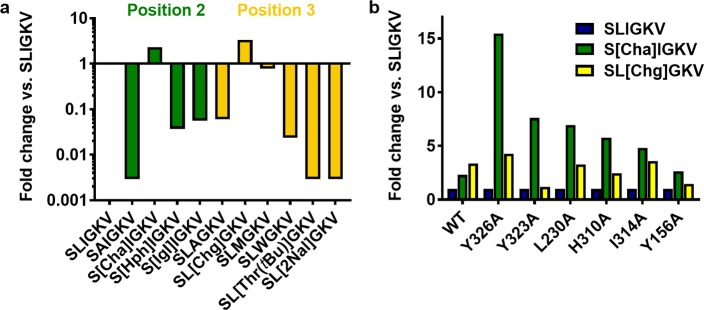
Figure 3.
Interactions of hydrophobic side chains in positions 2 and 3 of SLIGKV. (a) Fold change in potency of modified peptides at WT calculated compared to that of SLIGKV, presented as the log transformed data such that more potent peptides show an increase and less potent peptides show a decrease. (b) Difference in fold change of potency of modified peptides at modified receptors, calculated compared to that of SLIGKV at each receptor. Peptide structures are shown in Figure S1, and potency data are presented in Tables 3 and 4.

