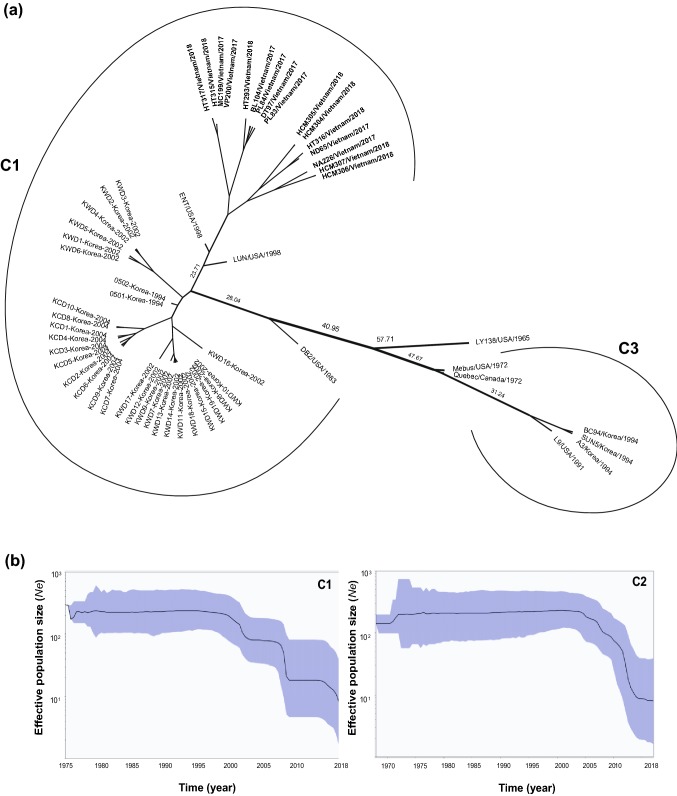
Fig. 2.
MCC tree constructed using the BEAST program and based on the full-length HE gene nucleotide sequences of BCoV (a), and a Bayesian skyline plot (BSP) based on the full-length S gene sequences of cluster 1 and 2 (b). The most probable year for the tMRCA within each lineage is shown (a). The plot depicts changes in the effective population size (Ne), and the dark line shows the effective population size estimated overtime (b). The upper and lower lines indicate the 95% HPD range of the BSP

