Figure 1.
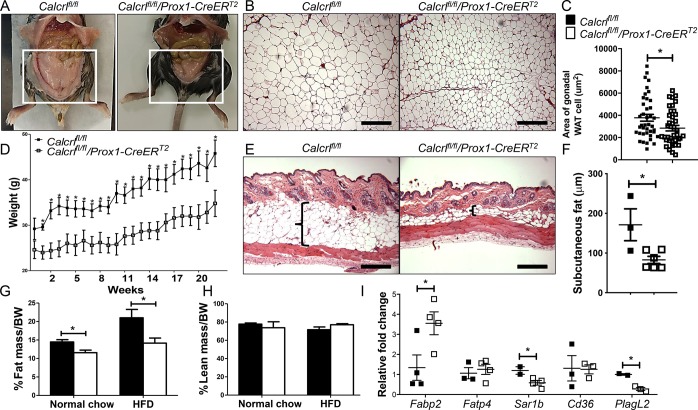
Loss of Calcrl severely attenuates body fat accumulation. (A) Gross images of Calcrlfl/fl and Calcrlfl/fl/Prox1-CreERT2 animals after 22 weeks of HFD. Boxed regions highlight reduced gonadal fat. N = 16 animals per genotype. (B, C) Representative H&E stained images of gonadal white adipose tissue (WAT) from Calcrlfl/fl and Calcrlfl/fl/Prox1-CreERT2 animals. Quantification of gonadal WAT cell area. Data are represented as mean ± SEM with significance determined by Student’s t test: *, P < 0.05. N = 8 animals per genotype; the area of 10 cells/animal across the entire field of view was calculated. Scale bars: 500 μm. (D) Weight gain of Calcrlfl/fl and Calcrlfl/fl/Prox1-CreERT2 animals over long-term HFD with significance determined by Student’s t test: *, P < 0.05. N = 5 animals per genotype. (E, F) Representative H&E stained skin sections with brackets highlighting the subcutaneous fat layer of Calcrlfl/fl and Calcrlfl/fl/Prox1-CreERT2 animals. Quantification of subcutaneous adipose layer width of Calcrlfl/fl and Calcrlfl/fl/Prox1-CreERT2 animals. Data are represented as mean ± SEM with significance determined by Student’s t test: *, P < 0.05. N = 6 animals per genotype. Scale bars: 500 μm. (G, H) MRI scans showing fat mass and lean mass of tamoxifen-treated Calcrlfl/fl and Calcrlfl/fl/Prox1-CreERT2 animals. Quantitative data are represented as % mass over body weight (BW) ± SEM with significance determined by 2-tailed, type 2 Student’s t test: *, P < 0.05. N = 4 Calcrlfl/fl and 9 Calcrlfl/fl/Prox1-CreERT2. (I) Relative expression of lipid transporters in tamoxifen-treated Calcrlfl/fl and Calcrlfl/fl/Prox1-CreERT2 whole duodenum. Gapdh and Rpl19 were used as housekeeping controls. Quantitative data are represented as % mass over body weight (BW) ± SEM with significance determined by 2-tailed, type 2 Student’s t test: *, P < 0.05. N = 4 animals per genotype.

