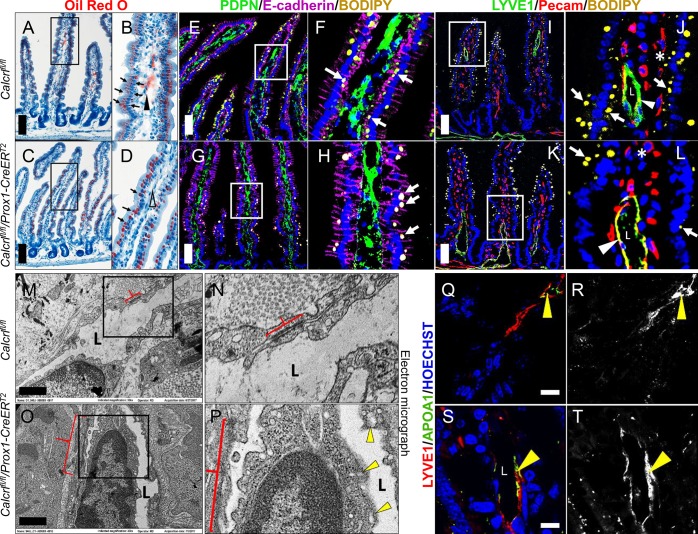
Figure 3.
Dysregulation of lipid trafficking upon Calcrl depletion. (A–D) Representative oil red O stained sections of tamoxifen-treated Calcrlfl/fl and Calcrlfl/fl/Prox1-CreERT2 animals after HFD challenge. Arrows highlight lipid deposits in enterocytes, and arrowheads mark lipid at the center of villi. Boxed regions are displayed as digitally zoomed insets on the right of each image. (E–H) Representative fluorescent images of Podoplanin and E-cadherin stained sections of tamoxifen Calcrlfl/fl and Calcrlfl/fl/Prox1-CreERT2 animals after BODIPY gavage. Arrows indicate BODIPY droplets. Boxed regions are displayed as digitally zoomed insets on the right of each image. (I–L) Representative fluorescent images of LYVE1 and PECAM-stained sections of tamoxifen Calcrlfl/fl and Calcrlfl/fl/Prox1-CreERT2 animals after BODIPY gavage. Arrows indicate BODIPY droplets, arrowheads highlight BODIPY accumulation within LECs, asterisk shows PECAM-labeled blood vessels, and “L” marks the lacteal lumen. Boxed regions are displayed as digitally zoomed insets on the right of each image. (M–P) Representative transmission electron microscopy images of tamoxifen Calcrlfl/fl and Calcrlfl/fl/Prox1-CreERT2 lacteals after HFD challenge. Arrowheads indicate lipid droplets, red brackets highlight adherens junctions, and “L” marks the lacteal lumen. Boxed regions are displayed as digitally zoomed insets on the right of each image. (Q–T) Representative fluorescent images of LYVE1 and APOA1 stained sections of tamoxifen Calcrlfl/fl and Calcrlfl/fl/Prox1-CreERT2 animals after BODIPY gavage. Arrowheads highlight APOA1 chylomicron accumulation within LECs or within the lacteal lumen. For all panels in Figure 3: N = 4–6 animals per genotype. Scale bars: 100 μm in (A, C); 50 μm in (E, G, I, K); 1 μm in (M, O).

