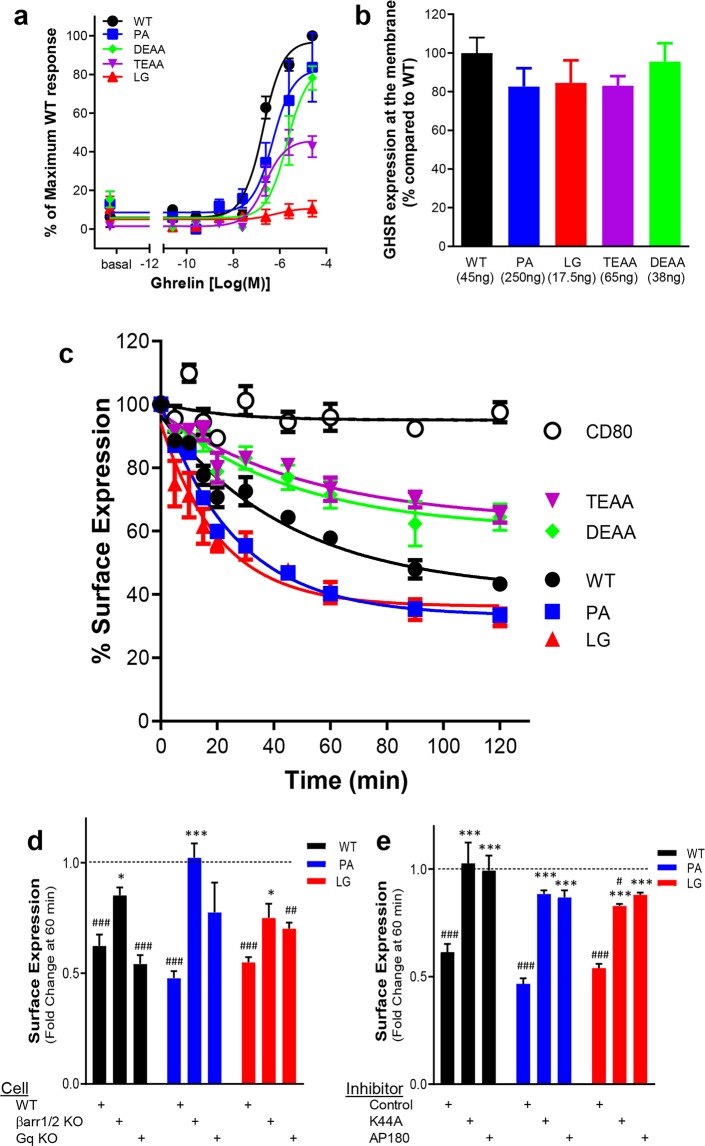
Figure 2.
Ligand-induced GHSR1a internalization. (a) The graph shows the ghrelin-mediated dose responses for the different receptor variants in a Ca2+ mobilization assay. The results are normalized to an ECmax of WT GHSR1a set at 100%. (b) Membrane expression of GHSR1a variants per cDNA plasmid transfection amount (per 48 well plates) used for panels c–e. (c) The curves depict 100 nM ghrelin-induced internalization of N-terminally tagged FAP-GHSR1a receptor variants standardized by a noninternalizing CD80 control. In panels d and e, results are presented as fold change following 60 min of 100 nM L585 treatment relative to membrane receptor expression at time 0. Vehicle treatment is set at 1. (#) indicates a significant difference between a receptor’s surface expression with L585 treatment versus vehicle treatment. (d) The bar graph shows the effects of Gq-protein and β-arrestin protein KO on GHSR1a WT, P148A, and L149G endocytosis. (*) indicates a significant difference in receptor surface expression with L585 treatment relative to results in WT control HEK293 cells. (e) The bar graph shows the effects of pcDNA empty vector control, dominant negative mutant K44A, or clathrin inhibitor protein AP180 transfection on GHSR1a WT, P148A, and L149G endocytosis. (*) indicates a significant difference in receptor surface expression with L585 treatment relative to pcDNA control transfection. (* or #, p < 0.05; ** or ##, p < 0.01; *** or ###, p < 0.001).

