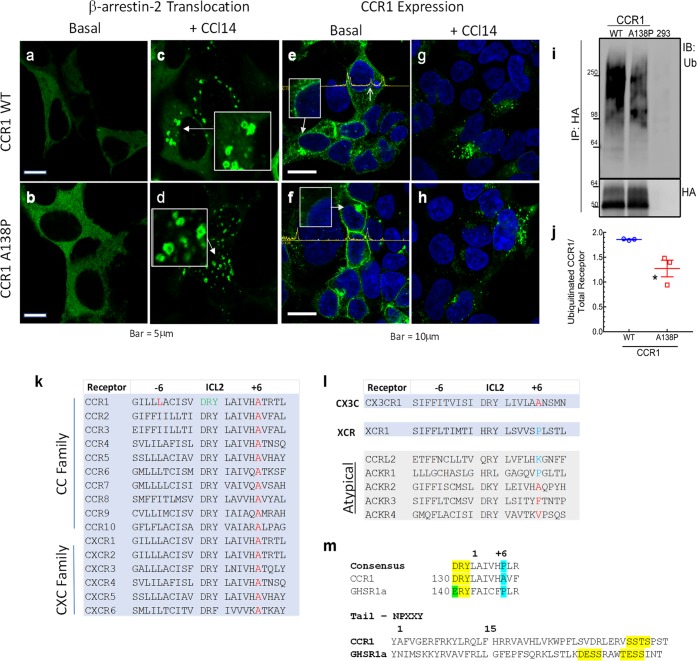
Figure 7.
β-arrestin and CCR1 Distributions in HEK293 Cells. Fluorescence images of β-arrestin-2–GFP in vehicle-treated cells containing (a) wild-type CCR1 or (b) CCR1-A138P. (c, d) Cells treated in parallel to panels a and b with 100 nM CCl14. Boxes provide 2× magnification of areas indicated by arrows demonstrating doughnut-shaped vesicles. Fluorescence images of vehicle-treated (e) HA-tagged wild-type CCR1 or (f) HA-tagged CCR1-A138P. Boxes show enlargements of perinuclear areas identified by corresponding arrows. The amplitude tracings across the images provide relative intensity measurements of the fluorescence from corresponding baseline intersected pixels and can be used to identify edges of plasma membrane or nuclear membrane (right arrow in panel e). (g, h) Fluorescence images of receptors from cells treated in parallel to those in panels e and f with 100 nM CCL14 for 30 min. (i) Western blot of total ubiquinated CCR1 or its variant from cells permanently expressing transfected WT CCR1, transfected CCR1-A138P, and no added receptor (from left to right). (j) Scatter plot of ubiquitinated CCR1 as in panel i normalized by total receptor (WT: 1.86 ± 0.01, A138P: 1.28 ± 0.17), N = 3 independent experiments. Bars represent Mean ± SEM; *, p < 0.05. Sequences of regions in human receptors for (k) ICL2 of the two predominant chemokine families, (l) ICL2 of the two remaining one member chemokine families and the atypical chemokines, and (m) the ICL2 DRY motif and +6 position of the CCR1 and GHSR1a compared to the rhodopsin family consensus motif (upper, yellow and blue highlights),2 and a C-tail alignment from the NPXXY motif for comparison of phosphorylation sites on CCR1 and GHSR1a (lower, in yellow).

