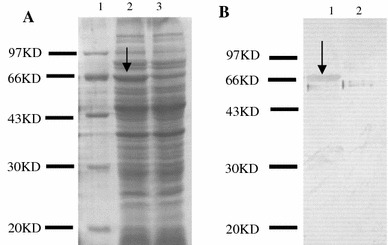
Fig. 2.

The SDS-PAGE (a) and Western blot (b) analyses of the cell lysates from the expressed product. Lane a1: MW, molecular mass marker; Lane a2: proteins from LNZ9000-rTGEV-SN induced by nisin; Lane a3: proteins from Lactococcus lactis NZ9000 harboring pNZ8112, induced by nisin; Laneb1: western blot analysis of the product of LNZ9000-rTGEV-SN; Lane b2: western blot analysis of the product of Lactococcus lactis NZ9000 harboring pNZ8112. Arrow indicates the expressed protein
