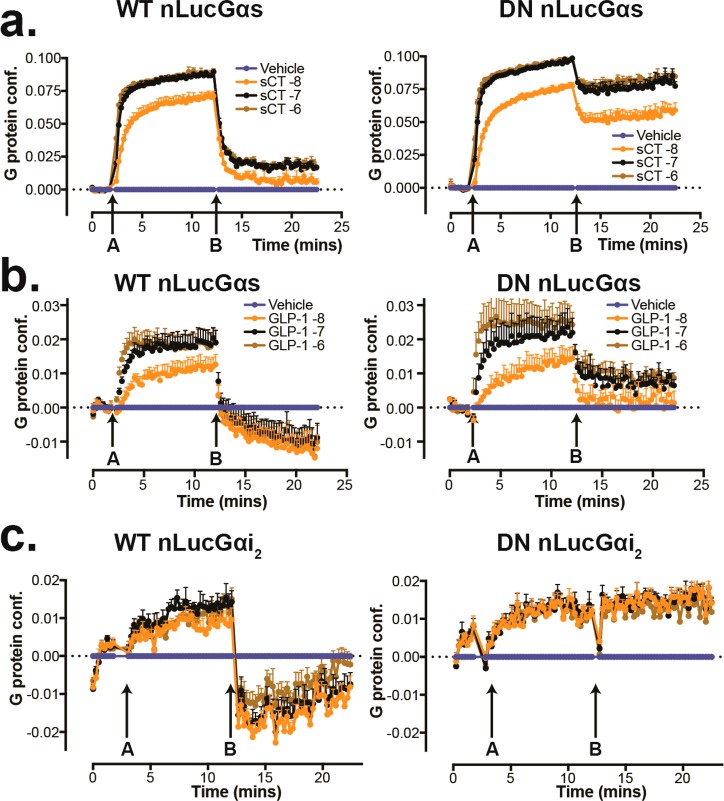
Figure 6.
Functional analysis of DN-G proteins. (a) Time-course for ligand-induced changes in BRET of WT-Gαs or DN-Gαs (nanoLuc tagged) and Gγ (Venus) at increasing concentrations of salmon calcitonin (sCT) (arrow, A) followed by the addition of 30 μM GTP (arrow, B) on membranes from HEK293 cells that lack endogenous Gαs and were stably transfected with the human CTR; the rate and magnitude of agonist-induced structural rearrangement are similar, but the DN-Gαs is resistant to GTP-induced conformational rearrangement. (b) Comparison of time-courses for agonist-induced changes in BRET of WT-Gαs/Gγ and DN-Gαs/Gγ are shown for GLP-1(7–36)NH2 activated GLP-1R; both WT- and DN-Gαs report the same difference in rate and extent of ligand-induced G protein conformational change (A); however, after the addition of 30 μM GTP (B), the DN-Gαs is less susceptible to conformational change. (c) time-course for GLP-1(7–36)NH2-induced changes in BRET of WT-Gαi2 or DN-Gαi2 (nanoLuc tagged) and Gγ (Venus) (A), followed by the addition of 30 μM GTP (B), on membranes from HEK293 cells that lack endogenous Gαs/Gαq/11/Gα12/13 and were stably transfected with the human GLP-1 receptor. The rate and magnitude of structural rearrangement are similar but the DN-Gαi2 is resistant to GTP-induced conformational rearrangement. All data are N = 3 + SEM.

