
Fig. 4.
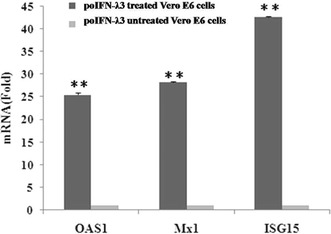
Expressions of OAS1, Mx1, and ISG15 induced by poIFN-λ3. The levels of OAS1, Mx1, and ISG15mRNA were measured by quantitative PCR, and the results were normalized by the GAPDH levels of each sample. Values represent the mean ± SD of three independent tests. P < 0.01 compared with the untreated Vero E6 cells