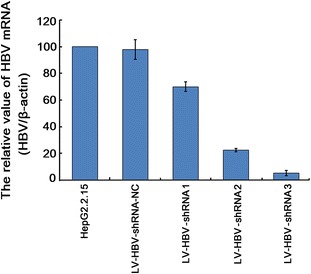
Fig. 3.

Impact of LV-delivered shRNAs on HBV RNA levels. HepG2.2.15 cells were transduced with the indicated LV-HBV-shRNA vectors; untreated HepG2.2.15 cells served as reference. At 96 h post-transduction, total RNA was isolated and HBV-specific transcripts were quantitated by real-time RT-PCR using primers specific for the HBV S gene. Quantitation of β-actin mRNA in the same samples served for normalization. Values are given as the ratio of HBV-specific versus β-actin specific RNAs; the ratio obtained for untreated HepG2.2.15 cells was set as 100 %. Values shown are the mean of three independent experiments; bars indicate SD. Numerical mean values were 97.6 ± 7.4 % for LV-HBV-NC (negative control); 70.0 ± 3.6 % for LV-HBV-shRNA1; 22.4 ± 1.2 % for LV-HBV-shRNA2; and 5.3 ± 1.9 % forLV-HBV-shRNA3
