
Fig. 2.
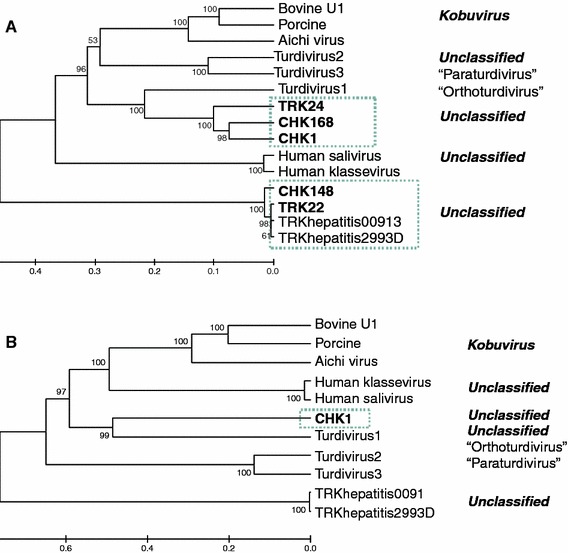
Phylogenetic analysis of complete 3Dpol (a), and 3A–3Cpro (b) protein sequences. The length of the individual proteins are listed in Table 3. The dendrogram was constructed by the UPGMA clustering method of MEGA version 3.1 with Poisson correction distance calculations and 1,025 bootstrap analyses