
Fig. 7.
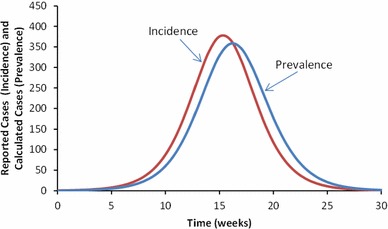
Incidence (new cases per week, red line, the same as in Fig. 6) and the prevalence (blue line) of Ebola in Liberia in 2014 as generated by the disease exportation model (Color figure online)
Official websites use .gov
A
.gov website belongs to an official
government organization in the United States.
Secure .gov websites use HTTPS
A lock (
) or https:// means you've safely
connected to the .gov website. Share sensitive
information only on official, secure websites.
Incidence (new cases per week, red line, the same as in Fig. 6) and the prevalence (blue line) of Ebola in Liberia in 2014 as generated by the disease exportation model (Color figure online)