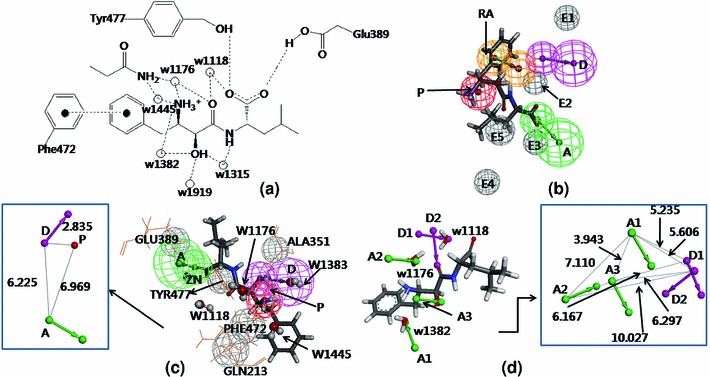
Fig. 3.

a Interaction of bestatin at the hAPN active site, hydrogen bonds and  interaction are shown in dotted line, water molecules are shown as spheres. b Mapping of bestatin (P2) on Model 1. c Mapping of bestatin on Model 2 (water molecules are shown in ball and stick form) and 3D-spatial arrangement and inter-feature distance constraints between the chemical features of Model 2 (in box). d Mapping of Model 3 with bestatin and catalytic water molecules (presented in stick form), 3D-spatial arrangement and inter-feature distance constraints between the chemical features of Model 3 (in box)
