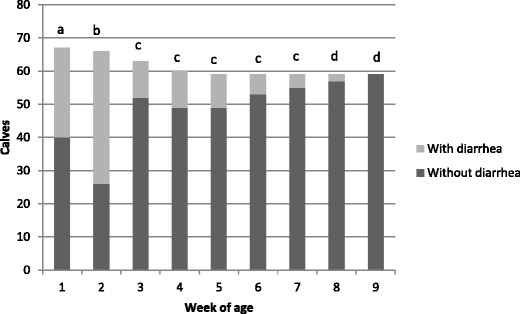
Fig. 1.

Frequency of diarrhea in calves, distributed according to week of age, in one Brazilian dairy cattle herd. A total of 67 calves were sampled between June and August 2008. Columns bars followed by different letters are statistically different according to chi-square test (P value = 0.05)
