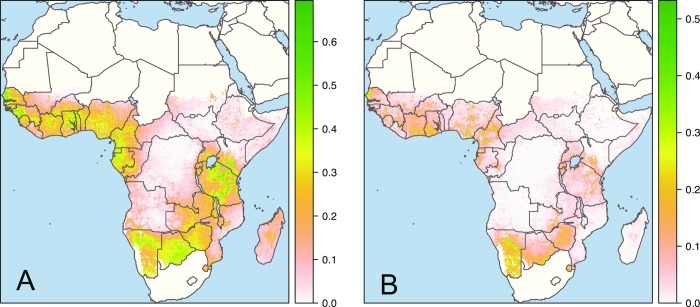
Fig 1. Changes in housing in sub-Saharan Africa between 2000 and 2015.
The maps show the absolute difference in prevalence (scale 0 to 1) of housing built with finished materials (A) and improved housing (B) in 2000 and 2015. Houses built with finished materials were those with at least two of three of the wall, roof, and floor made from finished materials (e.g., parquet, vinyl, tiled, cement, or carpet floor), rather than natural or unfinished materials (e.g., earth, sand, dung, or palm floor). Improved houses were those with improved water and sanitation, sufficient living area, and finished building materials. Results are derived from a geospatial model fitted to 62 surveys representing 661,945 households (building materials) and 59 surveys representing 629,298 households (house type) [13]. Areas in green show the greatest changes in housing. First published in Nature [13]. The base map was created by Samir Bhatt of the Malaria Atlas Project, Oxford.

