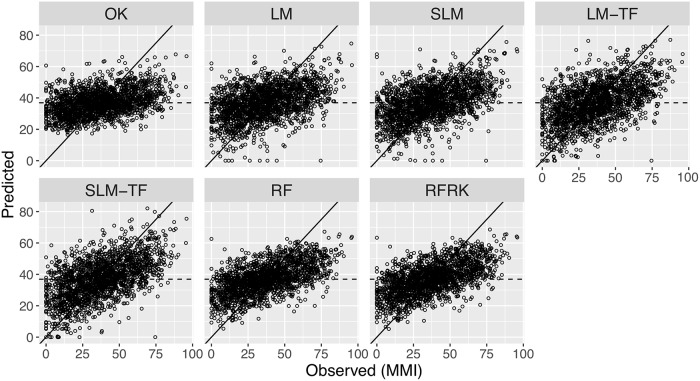
Fig 4. Scatter plots of predicted versus observed MMI values.
Predictions are from 10-fold cross-validation. The 1-1 line (solid) and mean observed MMI value (36.9; dashed horizontal line) are also shown in each panel. Labels for the seven models are defined in Table 1 and the text.

