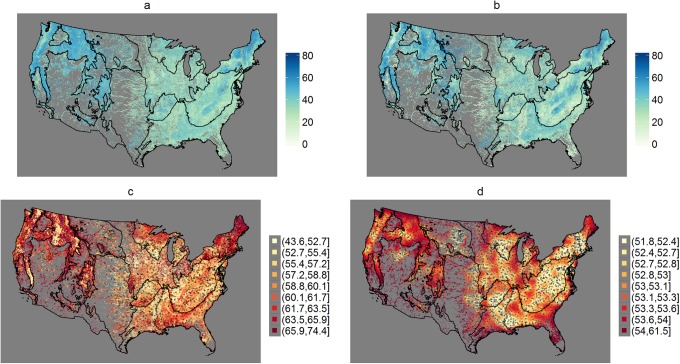
Fig 5. Maps of MMI predictions and prediction errors.
The maps show the MMI predictions and lengths of 90% prediction intervals for RF (a,c) and SLM with transformations (b,d). The prediction sites are the 1.1 million perennial stream reaches (catchments) in the NRSA sampling frame. Note the different scales in the maps of prediction interval lengths (c,d).

