
Fig. 3.
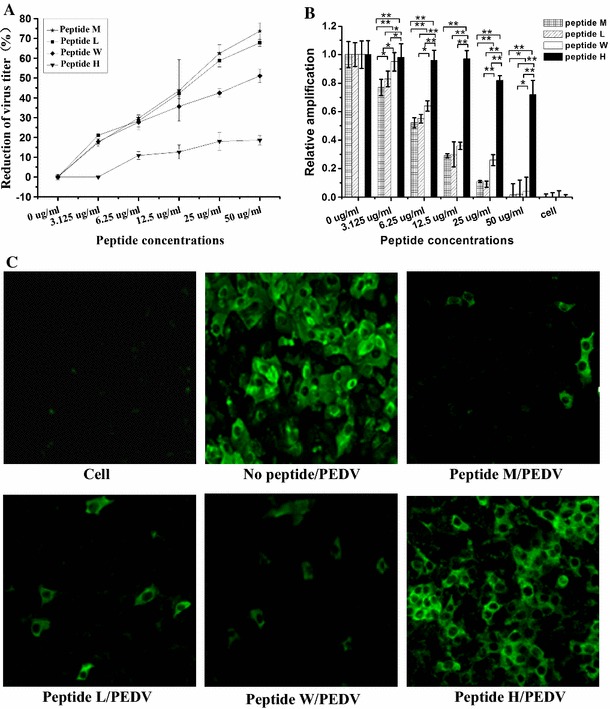
Anti-PEDV activity of peptides M, L, W and H. a Plaque-reduction assay. The reduction in virus titer is presented with changing peptide concentration. Inhibition rates were calculated as follows: [1 − (plaques in treated wells/plaques in control wells)] × 100. b Real-time PCR. Total RNA was extracted and PEDV N and β-actin mRNA were subjected to real-time PCR. Relative amplification ( method)of the PEDV N gene was normalized to β-actin. All data are expressed as mean ± SD. Statistical significance is represenced by *p < 0.05; **p < 0.01 relative to peptides M, L, W or H. c IFA. Results show VeroE6 cells treated with peptides M, L, W or H (50 µg/ml each) prior to PEDV infection. Untreated VeroE6 cells and PEDV-infected VeroE6 cells were used as controls