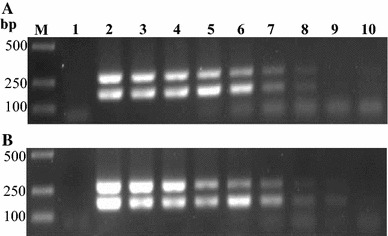
Fig. 2.

Comparison of the sensitivity of nanoPCR and conventional PCR assays. Serial tenfold dilutions of recombinant plasmids pMD18-T-PEDV-N and pMD18-T-TGEV-N were used as templates. The results of conventional PCR and nanoPCR assays are shown in (a) and (b), respectively. Lane M DL2000 marker, Lane 1 negative control, Lanes 2–10 pMD18-T-PEDV-N concentrations ranging from 7.6 × 10⁸ to 7.6 × 100 copies/μL, pMD18-T-TGEV-N concentrations ranging from 8.5 × 10⁸ to 8.5 × 100 copies/μL
