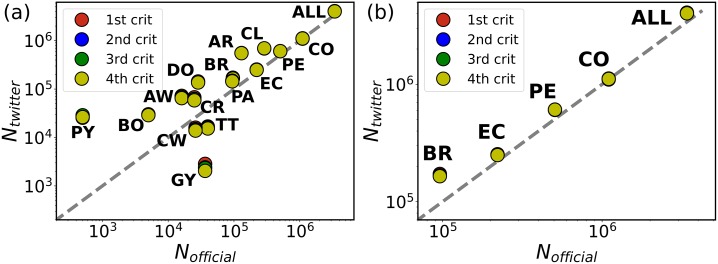
Fig 1. Country-level flow validation.
Comparison between the migrant flows estimated from the upscaled Twitter data Ntwitter following the different resident criteria and the official numbers Nofficial from the UNHCR in January 2018. These official numbers in some countries are projections. Each point corresponds to a country. The panel (a) shows all the countries of the considered area, and the panel (b) specific detail for neighboring countries from which a humanitarian crisis has been reported. In both cases, the grey dashed lines are the diagonal. The correlation produces a R2 = 0.98 for all the countries and R2 = 0.99 for Brazil, Colombia, Ecuador and Peru alone. The country codes are Argentina (AR), Aruba (AW), Bolivia (BO), Brazil (BR), Chile (CL), Colombia (CO), Costa Rica (CR), Curaçao (CW), Dominican Republic (DO), Ecuador (EC), Guyana (GY), Panama (PA), Paraguay (PY), Peru (PE) and Trinidad and Tobago (TT). The panels are displayed in log-log scale due to the several orders of magnitude of the flows. However, the important point here is to verify the identity between expected and measured values and, therefore, the correlation analysis is performed with R2 in the original scale.

