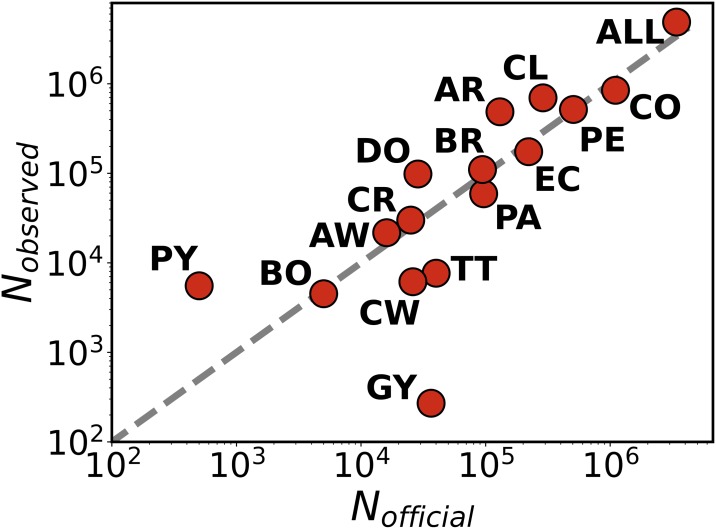
Fig 5. Validation of new residents.
Scattered plot with the comparison between the estimations of new Venezuelan residents obtained with our method and the official data from the international agencies in each country. Every circle is a country, the dashed gray line is the diagonal. In this case, the correlation is R2 = 0.97. The plot is displayed in log-log scale due to the several orders of magnitude of the number of residents. As before, the important point is to verify the identity and, therefore, the correlation analysis is performed in the linear scale.

