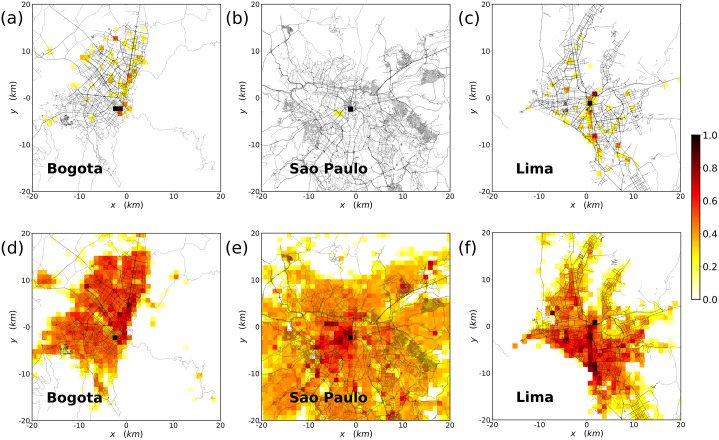
Fig 6. Residence locations in the main cities.
Log-scale heat map of the population distribution in the main cities of the area. In the top row, the data corresponds to numbers of migrant TUVs and in the bottom to the local geolocated Twitter users. The scale of the heatmap is logarithmic and the maximum is rescaled in each of the maps. In (a) and (d), results for Bogotá (Colombia). In (b) and (e) for São Paulo (Brazil. And, in (c) and (f), for Lima (Peru). Data on roads by OpenStreetMap contributors and from MapCruzin, all available under the Open Database License ODbL. For more information check [56].

