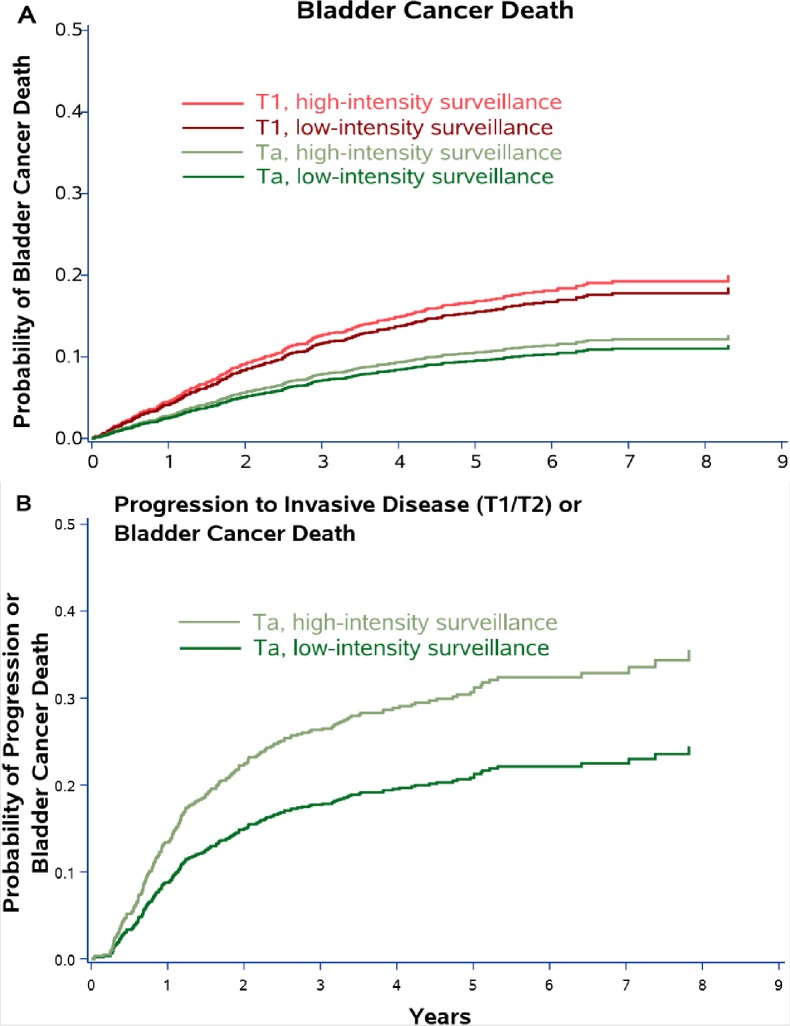
Fig 2. Sensitivity analyses, now including any patients who died or had their last contact with the VA health system during the first two years after diagnosis.
Cumulative incidence plots showing the probability of 1) bladder cancer death by Ta versus T1 disease and by cystoscopic surveillance intensity (Panel A) and 2) progression to invasive disease (T1 or T2) or bladder cancer death among those with Ta disease (Panel B). Data are from Fine and Gray competing risk models adjusted for propensity score and receipt of intravesical therapy with death from other causes modeled as a competing risk.

