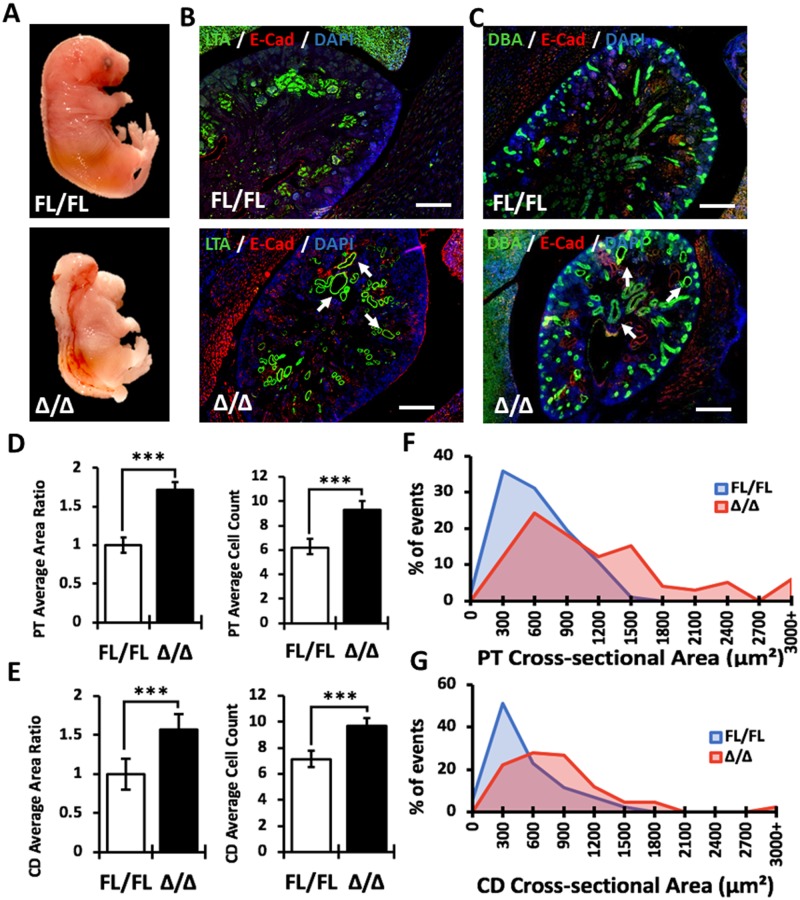
Fig 3. Analysis of kidney morphology in null E17.5 Vangl2Δ/Δ embryos.
(A) E17.5 Vangl2Fl/Fl (upper image) and null Vangl2Δ/Δ (lower image) embryos. (B) Immunofluorescence staining of E17.5 Vangl2Fl/Fl and Vangl2Δ/Δ kidney sections with LTA (green), E-cadherin (marker for lateral cell connections, red) and DAPI (blue); cystic and dilated proximal tubules are indicated by arrows. Scale bars, 100 μm. (C) Immunofluorescence staining of E17.5 Vangl2Fl/Fl and Vangl2Δ/Δ kidney sections with DBA (green), E-cadherin (red) and DAPI (blue); cystic and dilated collecting ducts indicated by arrows. Scale bars, 100 μm. (D) Measurements of proximal tubule (PT) area ratio and cell count: Vangl2Fl/Fl (n = 80), Vangl2Δ/Δ (n = 77). (D) Measurements of collecting duct (CD) area ratio and cell count: Vangl2Fl/Fl (n = 88), Vangl2Δ/Δ (n = 86). (E) Percentage of events within a given range of tubular cross-sectional area of proximal tubules. (F). Percentage of events within a given range of tubular cross-sectional area of collecting duct tubules. Mean ± standard error of mean is shown in all graphs. p<0.05 (*), p<0.001 (**), p <0.0001 (***).

