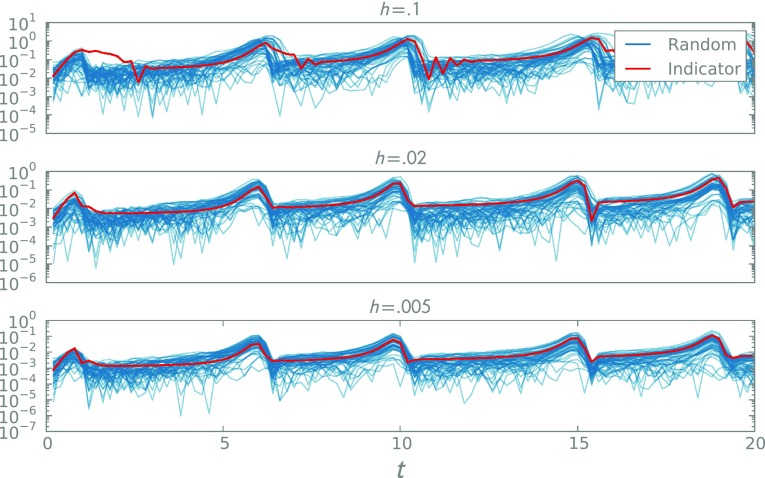
Fig. 4.
A comparison of the error indicator for the V species of the FitzHugh–Nagumo model (blue) and the observed variation in the calibrated probabilistic solver. The red curves depict 50 samples of the magnitude of the difference between a standard Euler solver for several step-sizes and the equivalent randomised variant, using , maximising

