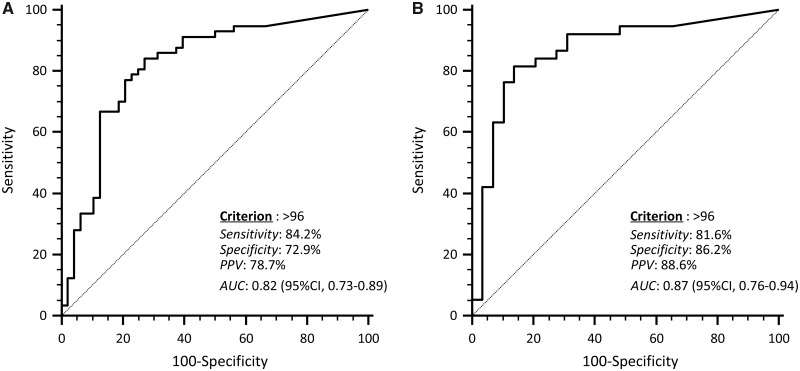
Figure 4.
ROC curve analysis of PLA staining score in identifying Parkinson’s disease patients. The optimal criterion in the overall population (A) and in consecutive Parkinson’s disease cases and consecutive healthy controls (B) is indicated along with its sensitivity, specificity, positive predictive value (PPV) and the area under the curve (AUC).

