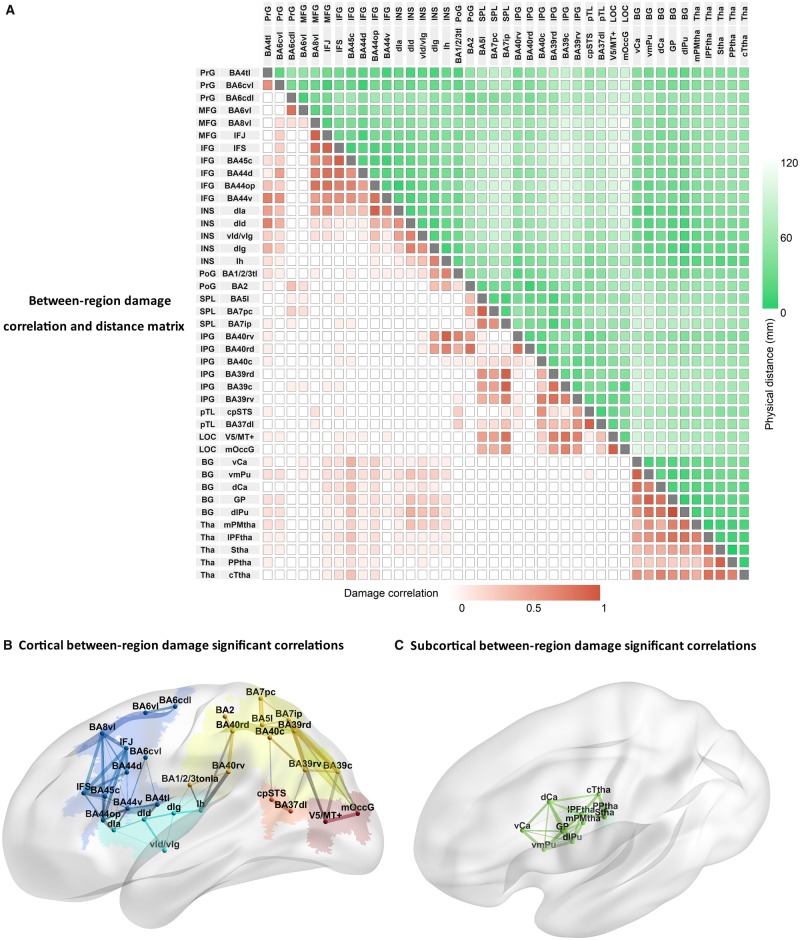
Figure 4.
Proportion damage correlations between 41 brainconnectome regions (Fan et al., 2016). (A) Matrix of between region damage correlations and distances. Label colours depict different lobules: blue = frontal lobe; cyan = insula; yellow: = parietal lobe; orange = temporal lobe; red = occipital lobe; green = thalamus. Increasing colour intensity reflects either increasing correlations of proportion damage between regions (in red) or decreasing distance between regions (in green). Depictions of correlations between proportion damage across cortical (B) and subcortical regions (C). Line thickness reflects the magnitude of correlation coefficients (where r’s > 0.53; P < 0.05 Bonferroni correction). Correlations between lobes are shown in grey and within lobule as the same colour as the lobule itself. BA44op = opercular BA44; BA4tl = BA4 (tongue and larynx region); BA7ip = intraparietal BA7; BA7pc = postcentral BA7; BG = basal ganglia; c = caudal; Ca = caudate; d = dorsal; GP = globus pallidus; Ia = dorsal agranular insula; Id = dysgranular insula; IFG = inferior frontal gyrus; IFS = inferior frontal sulcus; Ig = granular insula; Ih = hypergranular insula; INS = insula; IPL = inferior parietal lobe; l = lateral; LOG = lateral occipital lobe; m = medial; MFG = middle frontal gyrus; OccG = middle occipital gyrus; p = posterior; PFtha = pre-frontal thalamus; PoG = postcentral gyrus; PrG = precentral gyrus; Ptha = parietal thalamus; pTL = posterior temporal lobe; Pu = putamen; PMtha = pre-motor thalamus; r = rostral; s = superior; SPL = superior parietal lobe; STS = superior temporal sulcus; Tha = thalamus; IFJ = inferior frontal junction; Ttha = temporal thalamus; v = ventral.

