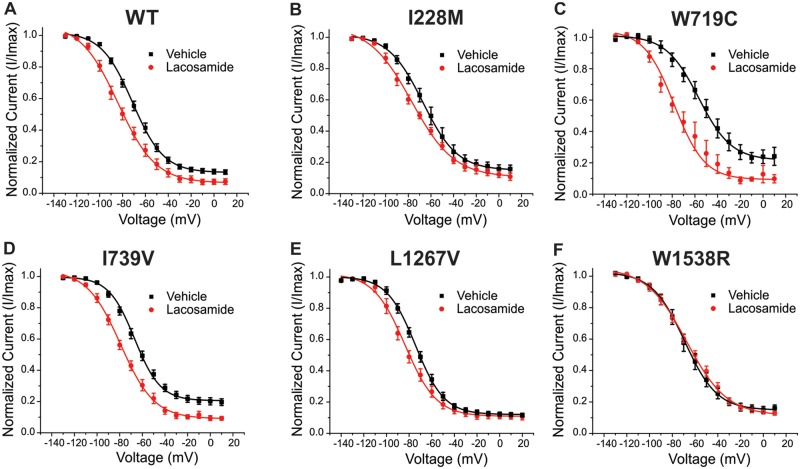
Figure 4.
Lacosamide effects on slow inactivation for each Nav1.7 variant. The averaged voltage-dependence of slow inactivation curves in the presence (red) or absence (black) of lacosamide are shown for (A) wild-type (WT), (B) I228M, (C) W719C, (D) I739V, (E) L1267V and (F) W1538R. The average V1/2s calculated from of the Boltzmann fits are listed in Table 1.

