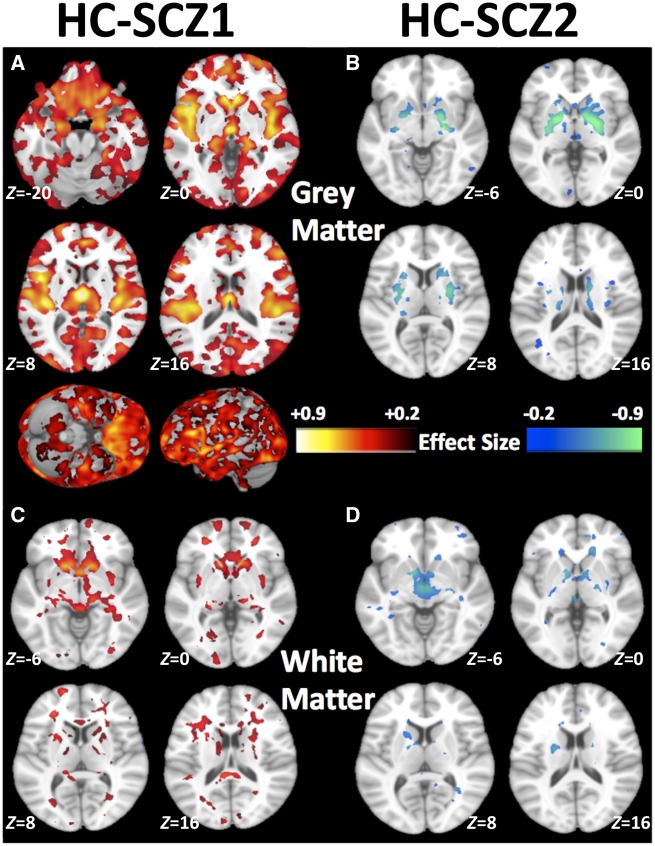
Figure 2.
Patterns of grey and white matter volumes identifying the two subtypes. Compared to healthy controls (HC), (A) schizophrenia Subtype 1 (SCZ1) exhibits widespread patterns of smaller grey matter volumes especially in the thalamus, nucleus accumbens, medial temporal, medial prefrontal/frontal and insular cortices, (B) schizophrenia Subtype 2 (SCZ2) exhibits larger grey matter volumes in the basal ganglia (pallidum, putamen, and parts of caudate), (C) schizophrenia Subtype 1 shows smaller white matter volumes, and (D) schizophrenia Subtype 2 shows larger white matter volumes, especially in the internal capsule. Effect size (Cohen’s d) maps were generated from regional volumetric maps masked by the set of regions that showed statistically significant differences (PFDR < 0.05) in the MIDAS analysis.

