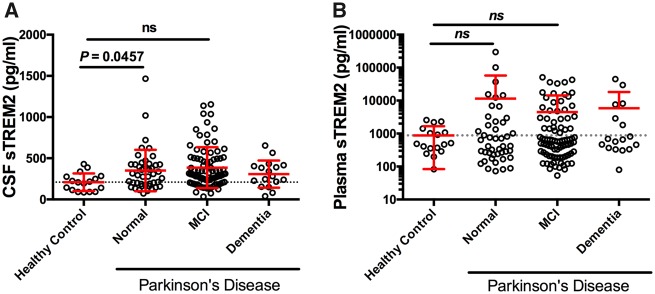
Figure 1.
CSF and plasma sTREM2 in healthy control and Parkinson's disease participants stratified according to cognitive status. (A) Scatter plot showing levels of CSF sTREM2 are elevated in PD-Normal subjects relative to healthy controls. (B) Plasma sTREM2 concentration is not significantly different across any of the diagnostic groups. Solid bars represent the mean and standard deviation (SD). CSF and plasma sTREM2 data were log-transformed and analysed using a one-way ANCOVA with age and gender as covariates, followed by post hoc multiple comparisons using Tukey contrasts. ns = not significant.

