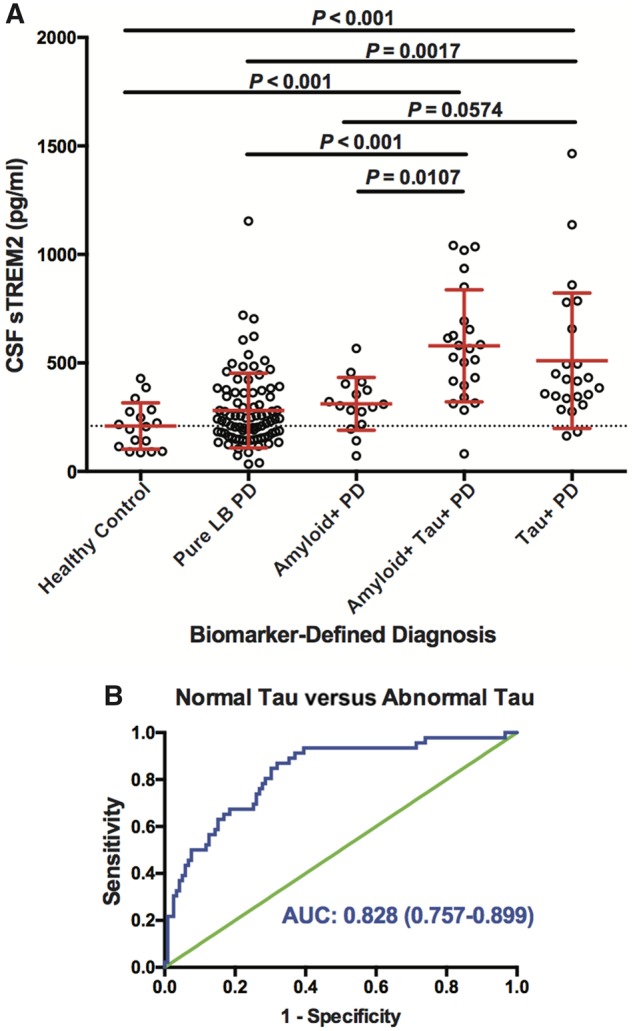
Figure 3.

CSF sTREM2 concentration across biomarker-defined diagnostic profiles. (A) CSF amyloid and tau concentrations were used to stratify participants into one of five CSF biomarker-defined groups: (i) healthy control subjects with normal amyloid and tau; (ii) patients with Parkinson’s disease with normal amyloid and tau [pure Lewy body (LB)-PD]; (iii) patients with Parkinson’s disease with abnormal amyloid and normal tau (PD Amyloid+); (iv) patients with Parkinson’s disease with normal amyloid but abnormal tau (PD Tau+); and (v) patients with Parkinson’s disease with both abnormal amyloid and tau (PD Amyloid+ Tau+). Log-transformed CSF sTREM2 data were analysed using a one-way ANCOVA adjusted by age and gender followed by Tukey contrasts post hoc multiple comparisons. Red bars indicate mean and SD. (B) Receiver operating characteristic (ROC) curve analysis of CSF sTREM2 in discriminating Parkinson’s disease with tau co-pathology from Parkinson’s disease without tau pathology. The area under the curve was 0.828 (95% CI = 0.757–0.899).
