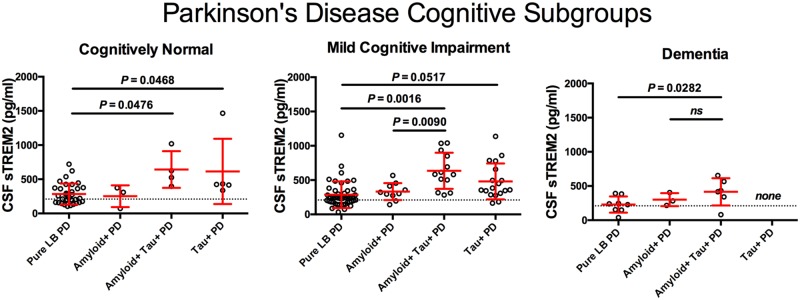
Figure 4.
CSF sTREM2 according to abnormal amyloid and tau biomarker profile subgroups within each of the clinically defined Parkinson’s disease diagnoses. Scatter plot representing levels of CSF sTREM2 (log-transformed) in participants for each of the four biomarker subgroups defined by abnormal amyloid and/or tau within corresponding cognitive diagnosis. The Parkinson’s disease cognitive subgroups included cognitively normal Parkinson’s disease participants, Parkinson’s disease with mild cognitive impairment, and Parkinson’s disease with dementia. Log-transformed CSF sTREM2 data were analysed using a one-way ANCOVA and were adjusted by gender and age followed by post hoc multiple comparisons using Tukey contrasts. Red bars indicate mean and SD. ns = not significant.

