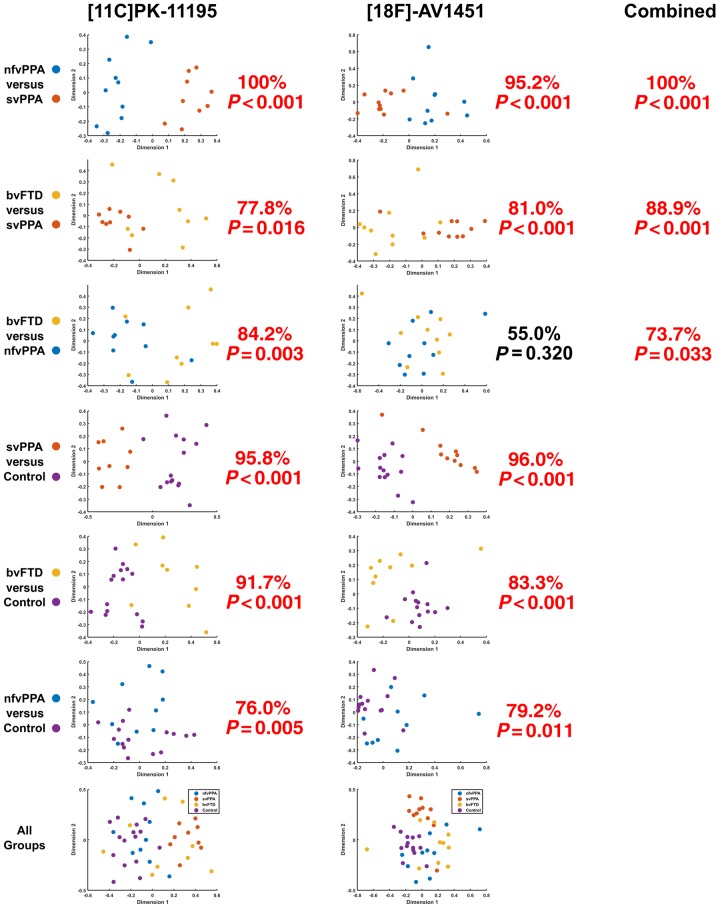
Figure 4.
Pairwise classification accuracy for each ligand. 11C-PK-11195 (left), 18F-AV-1451 (middle), and using combined data (right). The graphs represent a 2D projection of the between-individual PET signal distribution dissimilarity calculated according to the squared metric stress criterion. A 10-fold cross-validated support vector machine was applied to each plot, and the classification accuracy compared to a null distribution of 1000 randomizations for non-parametric significant testing. For each comparison, percentage classification and P-value is stated. In simple terms, this means that the similarity of the distribution of ligand binding across the brain for each individual was assessed irrespective of the absolute magnitude of binding (and therefore not determined by differences in ligand affinity for different pathological subtypes). Note how in the top left plot (nfvPPA versus svPPA for 11C-PK-11195) two groups of patients are clearly separated. By contrast, in the second column third row (bvFTD versus nfvPPA for 18F-AV-1451) the points are intermingled, with only chance-level classification.

