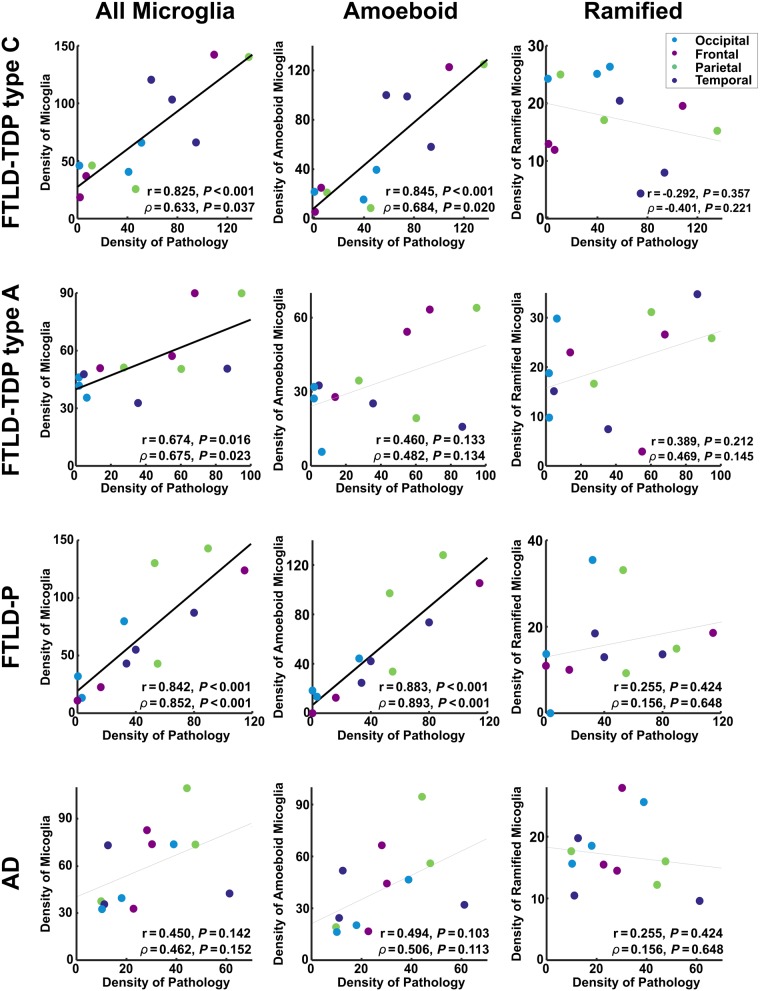
Figure 6.
The relationship between protein aggregation and microglia in each post-mortem sample. Densities are quantified as the number of microglia or pathological inclusions per square millimetre. Each point represents a single brain region in a single individual. The Pearson correlation (r), and the partial correlation (ρ) after factoring out the density of cell nuclei are shown for each relationship, along with the corresponding P-value. Trend lines are emboldened when both correlation and partial correlation were significant at α < 0.05.

