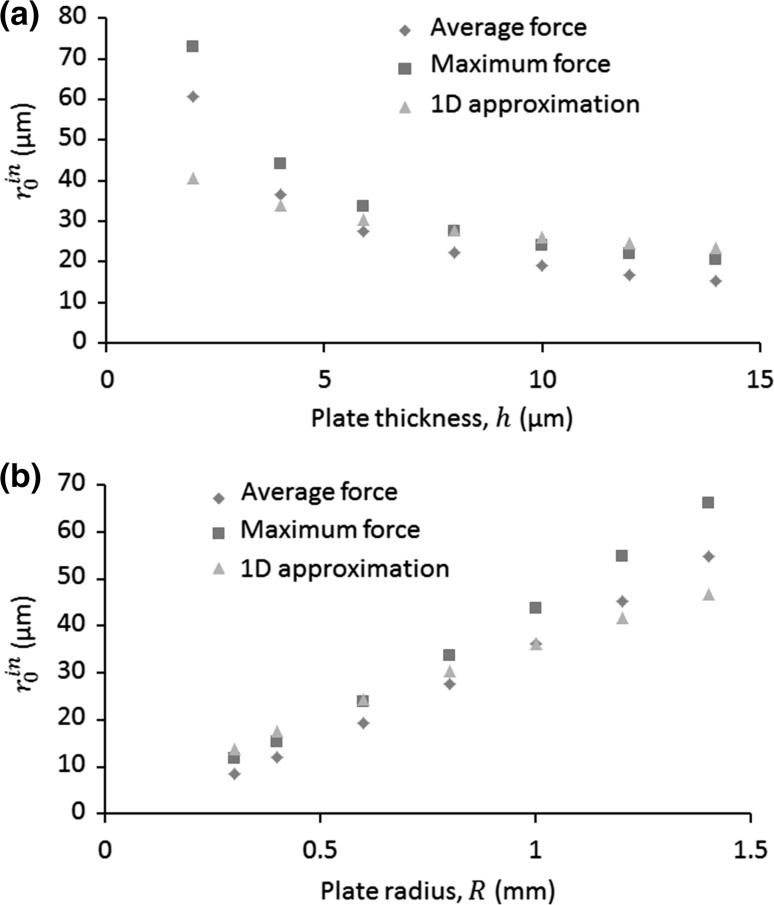
Fig. 10.
(Colour online) Comparisons on the threshold in-plane particle sizes between the modelling and theory, where the diamonds and squares show the modelled values calculated from the averaged and maximum forces over the bottom surface (with wall effect), respectively, and triangles show the calculated values using Eq. (27). For (a), the plate radius is the same, mm, and the plate thickness is the same for (b), µm

