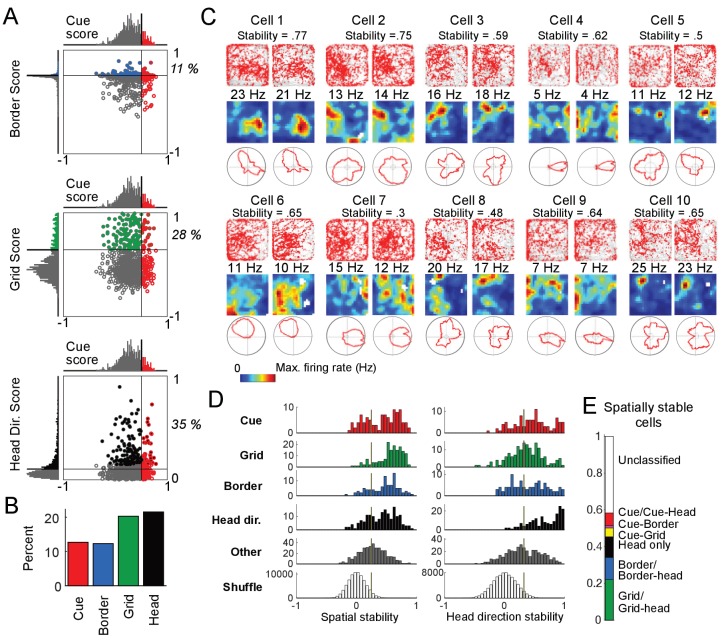
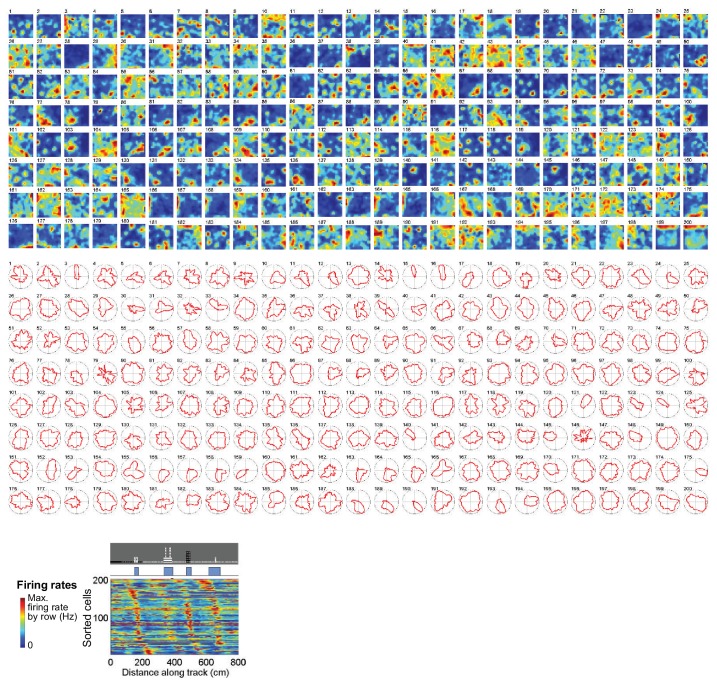
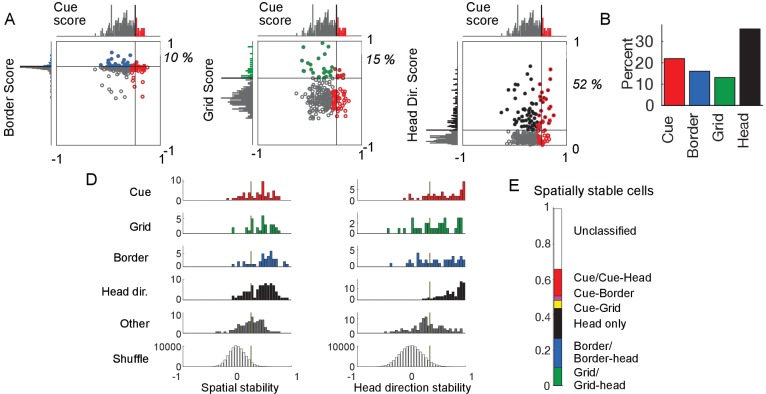
Figure 3. Cue cell activity during foraging in a real arena.
(A) Relative distributions of cue scores compared to border, grid, and head direction scores. Thresholds were calculated as the value that exceeds 95% of the shuffled scores. The solid line indicates the threshold for each score that was used to determine the corresponding cell type (Materials and Methods). Cells are color-coded for whether they are cue (red), grid (green), border (blue), or head direction cells (black). The percentage of the cue cell population that was conjunctive for border, grid, and head direction is shown in each plot. (B) Percentage of each cell type in the dataset. (C) Examples of the spatial stability of the spatial firing rates of cue cells in a real arena. The recording of each cell was divided in half. The spatial firing rates of the first and second halves are shown for each cell in the left and right columns. Within each column: top: plots of spike locations (red dots) and trajectory (gray lines); middle: the 2D spatial firing rate (represented in a heat map with the maximum firing rate indicated above); bottom: head direction firing rate. The stability was calculated as the correlation of these two firing rates and shown at the top for each cell. (D) Histograms of the spatial and head direction stability of the 2D real environment firing rates by cell type. (E) Percentage of 2D real environment stable cells that are of a certain type. Cell types are color-coded: red = cue cell, green = grid cell, blue = border cell, black = head direction cell.


