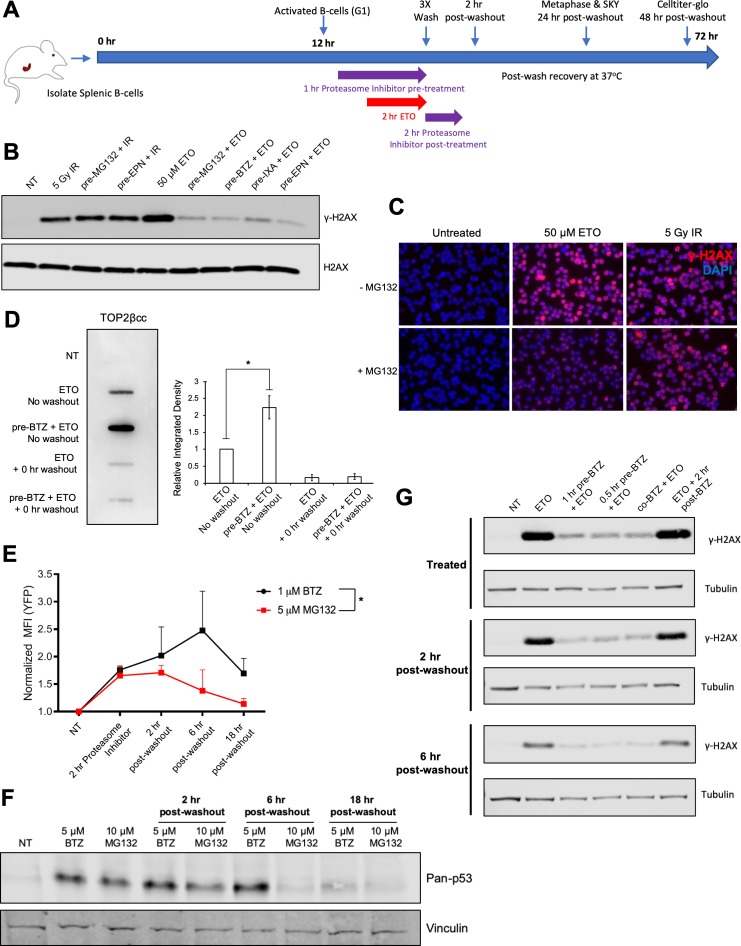
Figure 1. Proteasome machinery is essential for triggering DNA damage response to ETO treatment.
(A) As indicated in the schematic, primary splenic B-cells were isolated from mouse spleens and activated with a cocktail of Il-4, LPS, and RP105. 12 hr post-activation, while the B-cells were still in the G1 phase of the cell cycle, they were pre-treated with proteasome inhibitor (10 µM MG132 or 5 µM Bortezomib) for 1 hr prior to an additional 2 hr co-treatment with 50 µM ETO. Following the ETO pulse, the cells were washed with ice cold drug-free media (3 × 5 min spin at 1500 rpm and 4°C to pellet B-cells between washes; 15–20 min total time to complete washout), then returned to fresh drug free media and allowed to recover at 37°C for up to 48 hr. In the case of post-treatment, proteasome inhibitor was added to the wash media and then the cells were incubated for an additional 2 hr at 37°C with proteasome inhibitor only. For western blot and ICE assay analysis, cells were harvested immediately following drug treatment or washout (0 hr washout). For metaphase and SKY analysis, cells were harvested 24 hr following washout. For CellTiter-Glo viability, cells were harvested 48 hr following washout. For END-seq analysis, cells were harvested before drug washout, immediately following washout (0 hr washout), or after a 2 hr recovery in drug free media (2 hr washout). (B) γ-H2AX western blot in G1 WT primary splenic B-cells following 2 hr 50 µM ETO treatment ±1 hr proteasome inhibitor pre-treatment or 30 min following 5Gy IR ±1 hr proteasome inhibitor pre-treatment. Proteasome inhibitors tested: 10 µM MG132, 10 µM BTZ (Bortezomib), 2 µM EPN (Epoxomicin), 10 µM IXA (Ixazomib). (C) γ-H2AX immunofluorescence staining (red) in G1 arrested WT pre B cells following 2 hr, 50 µM ETO treatment ±1 hr 10 µM MG132 pre-treatment or 30 min after 5 Gy IR treatment ±1 hr 10 µM MG132 pre-treatment. (D) WT primary splenic B-cells (N = 3) in G1 were treated for 2 hr with 50 µM ETO ±1 hr, 5 µM BTZ pre-treatment. DNA was then isolated from cells following the ICE assay protocol and probed with anti-TOP2β antibody to quantify levels of TOP2βcc. Relative band intensity was measured for each sample and averaged for all three mice (ETO vs. pre-BTZ + ETO p=0.0168; ETO vs. ETO + 0 hr washout p=0.0045; pre-BTZ + ETO vs. pre-BTZ + ETO 0 hr washout p=0.0046; statistical significance calculated using student T-test). (E) eHAP cells were transfected for 48 hr with a YFP-tagged degron construct, which is degraded in a proteasome-dependent manner (Bence et al., 2001). Cells were then treated with 5 µM MG132 or 1 µM BTZ for 2 hr and then the drugs were washed out (3X wash in cold drug free media). Cells were fixed before washout with drugs still present or at 2 hr, 6 hr, and 18 hr post-washout. YFP signal intensity was quantified by FACS. (BTZ (before washout) vs. NT p=0.025; 2 hr post-washout MG132 vs NT p=0.049; statistical significance calculated using student T-test. MG132 vs BTZ p=0.038; statistical significance calculated using two column ANOVA). (F) pan-p53 levels in primary splenic B-cells treated for 3 hr with 10 µM MG132 or 5 µM BTZ. Drugs were then washed out and samples collected before washout or at 2 hr, 6 hr and 18 hr post-washout. (G) γ-H2AX levels in primary splenic B-cells as determined by Western blotting. Cells were treated with 50 µM ETO for 2 hr ±1 hr or 30 min pre-treatment, co-treatment and post-treatment with 5 µM BTZ at three different timepoints: before washout (treated), 2 hr and 6 hr post-washout.

