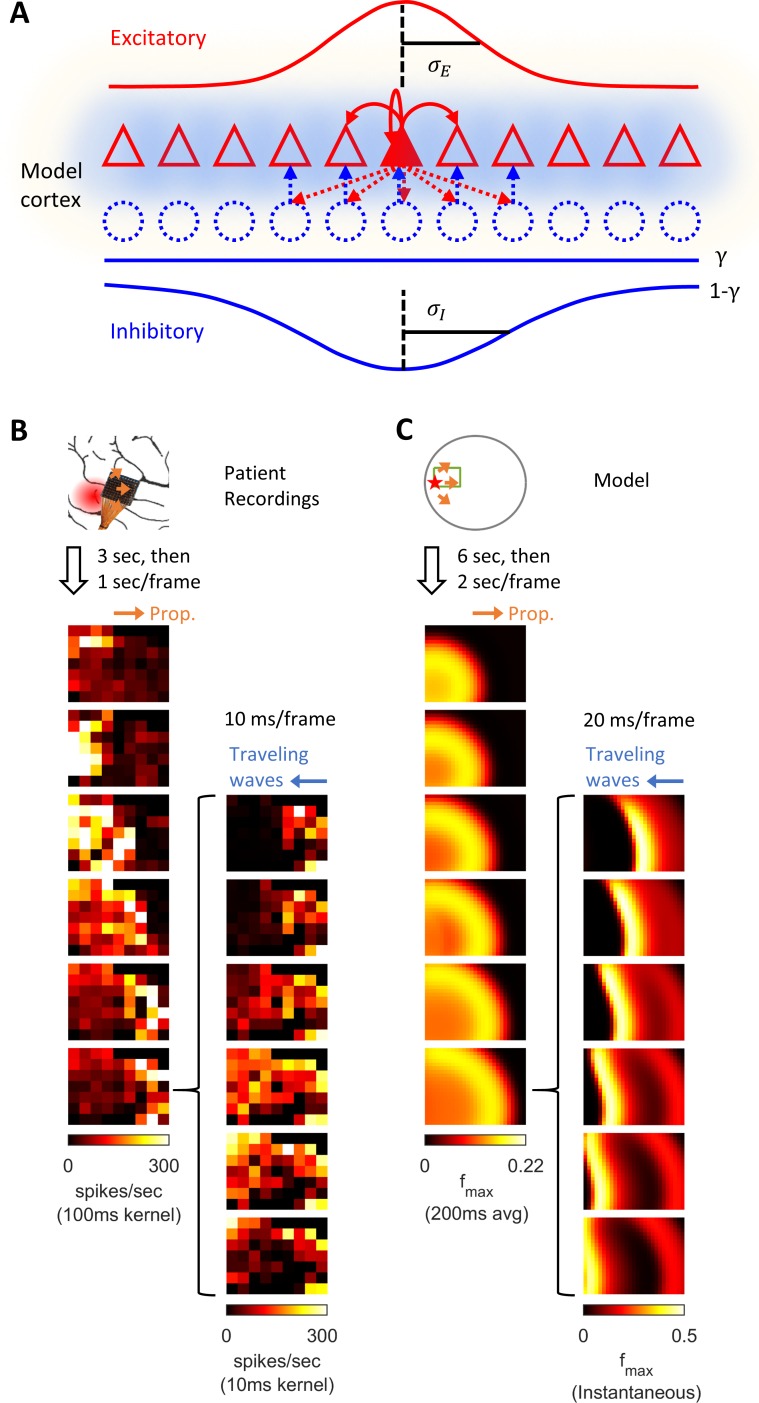
Figure 1. Model schematics and the comparison of patient recordings with model simulation results.
(A) Model schematic. Triangles: model neurons. Red solid arrows: excitatory recurrents with distance-dependent strength of spatial kernel width . Dashed blue circles: inhibitory neurons. Dashed red-to-blue arrows: distance-dependent di-synaptic recurrent inhibition with spatial kernel width , which accounts for of the total recurrent inhibition. The remaining fraction of the inhibition is distance independent and represented by the blue hues around model neurons. Interneuron membrane potentials are not explicitly modelled. (B) Microelectrode array recordings from Patient A. The red shaded area in the cartoon panel represents the clinically identified seizure onset zone. Orange arrows indicate the seizure propagation direction. The left column shows the spatiotemporal dynamics of multiunit activity in a slow timescale. The right column is a fast timescale zoom-in of the left bottom panel. Evolution of multiunit activity in a slow/fast timescale is estimated by convolving the multiunit spike trains with a 100/10 ms Gaussian kernel respectively. Left-to-right seizure recruitment was seen 3 s after the seizure onset (the orange arrow). Once recruited (left bottom panel), fine temporal resolution panels (the right column) showed right-to-left fast waves arose at the edge of the seizure territory (the blue arrow) and traveled toward the internal domain (fast inward traveling waves). (C) 2D rate model simulation results. Figure conventions adopted from B. The red star indicates where the seizure-initiating external current input was given (Id = 200 pA, duration 3 s, covering a round area with radius 5% of the whole neural sheet). Evolution of the neuronal activities within the green rectangle are shown in the panels. Notice the slow outward advancement of the seizure territory and the fast-inward traveling waves.

