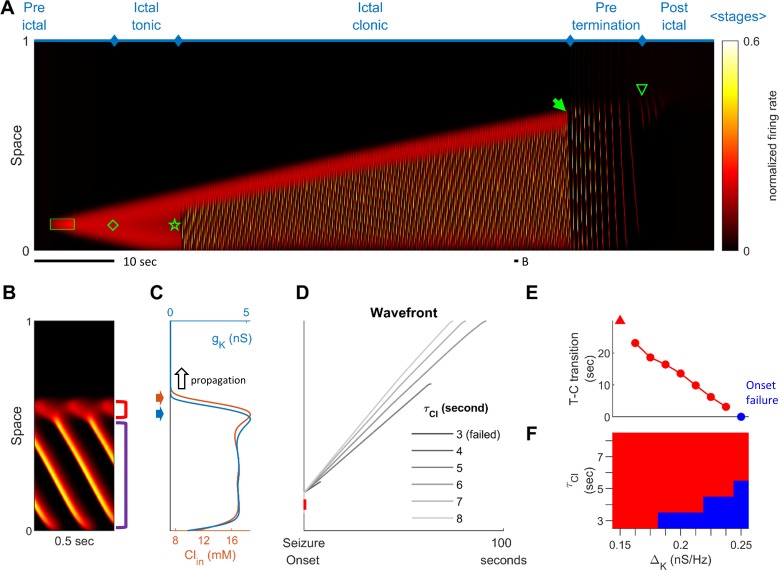
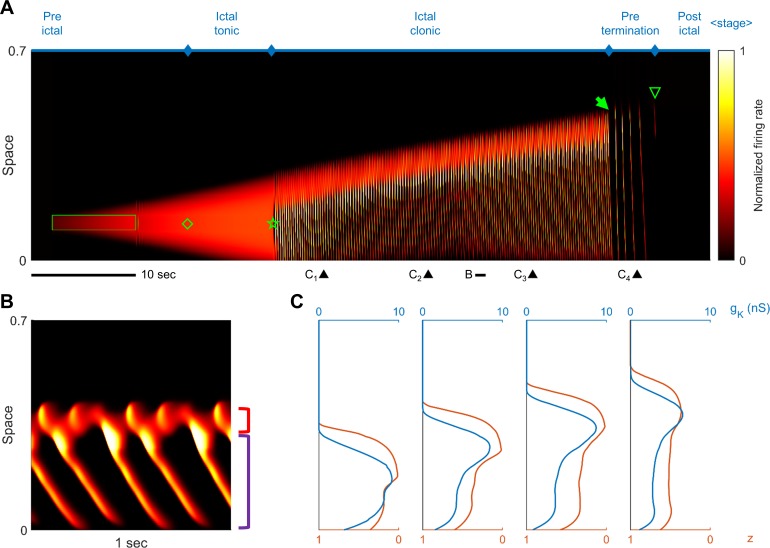
Figure 2. Stages of focal seizure evolution in a 1D rate model.
(A) Spatiotemporal evolution of a model seizure in one-dimensional space (EL=-57.5 mV). Horizontal axis: time; vertical-axis: space. Seizure dynamics is partitioned into the following distinct stages: pre-ictal, ictal-tonic, ictal-clonic, pre-termination, and post-ictal. Green box: seizure-provoking input (Id=200 pA). Green diamond: establishment of external-input-independent tonic-firing area. Green star: tonic-to-clonic transition. Green arrow: annihilation of the ictal wavefront. Green triangle: seizure termination. (B) Temporal zoom-in from Panel A during the ictal-clonic stage. Seizure territory further subdivided. Red square bracket: the ictal wavefront. Purple square bracket: the internal bursting domain. Thus, the top/bottom of the space corresponds to outside/inside of the seizure territory. Note that the fast-moving traveling waves move inwardly. Speed: 1.36 normalized space unit per second. Propagation speed of the ictal wavefront: 0.008 normalized space unit per second, for a traveling wave:wavefront speed ratio of 170. (C) Intracellular chloride concentration and sAHP conductance as a function of spatial position during the ictal-clonic stage, corresponding to the activity depicted in panel B. Note the distinct spatial fields of the two processes near the ictal wavefront. (D) Impaired chloride clearance allows seizure initiation and speeds up seizure propagation. Gray lines: the expansion of border of the seizure territory versus time. End of the lines: seizure termination, either spontaneous (τCl≤5 seconds) or after meeting the neural field boundary (τCl≥6 seconds). (E) Activation of the sAHP conductance leads to the tonic-to-clonic transition. Duration of ictal-tonic stage monotonously decreases as the sAHP conductance increases. Red triangle: persistent tonic stage without transition. (F) The seizure-permitting area in and parameter space. Blue/red: onset failure/success.


