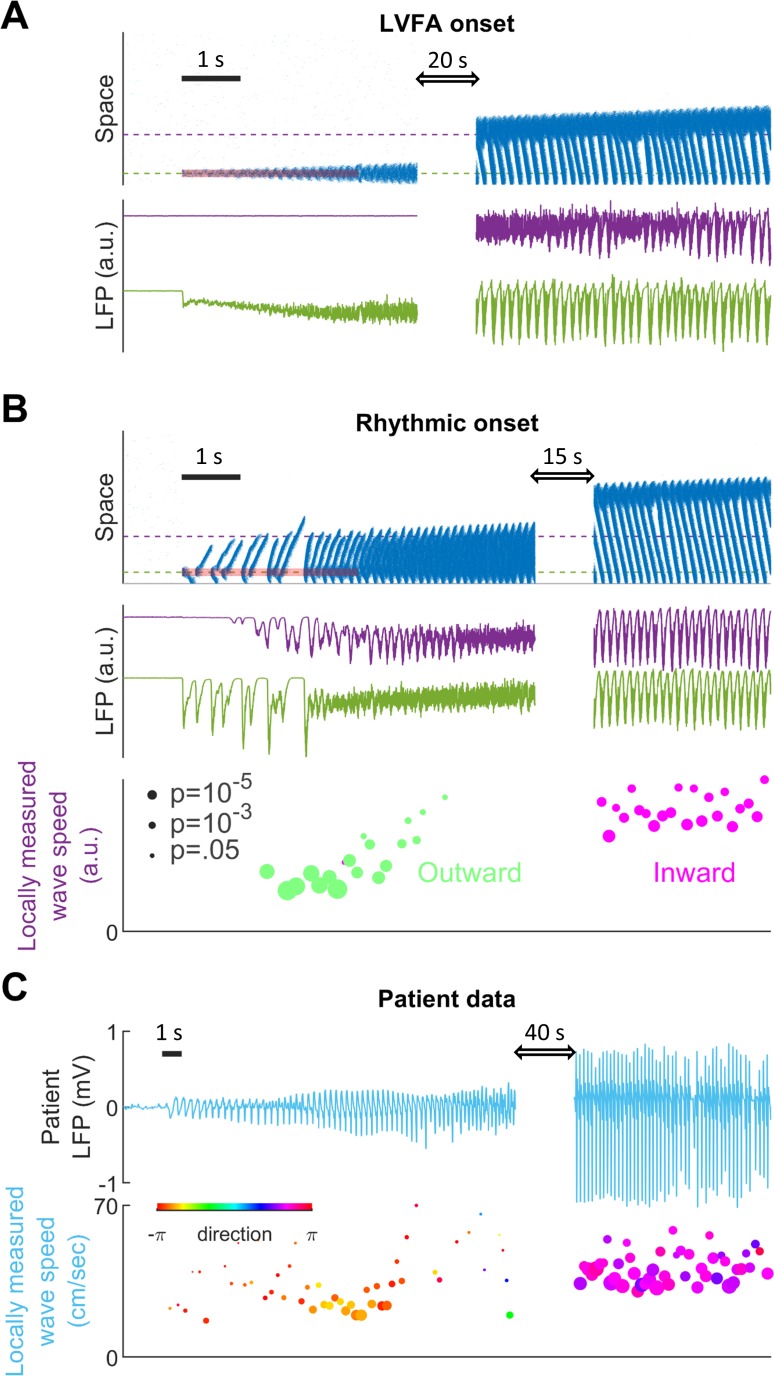
Figure 4. Subtypes of seizure onset pattern can arise from different distributions of recurrent inhibition.
(A) LVFA onset (=-60mV, =1/6, =1.5 mV). Upper subpanel: raster plot of the spiking model. Horizontal axis: time. Vertical axis: space. Shaded red zone: =80 pA. Green and purple dashed lines indicate where the simulated LFPs, shown in the lower subpanel, are read out. LVFA is associated with large DC shift of the LFP, corresponding to seizure onset and ictal wavefront invasion. Periodic LFP discharges emerge after ictal wavefront passage (blank region: 20-second simulation result skipped for visualization). (B) Rhythmic onset (=-60mV, =1/2, =1.5 mV). Upper and middle subpanels inherit the conventions of panel A. At seizure onset, waves are generated and travel outwardly (shaded red area, =80pA). They are associated with rhythmic LFP discharges and precede the fast activity. Inward traveling waves emerge after wavefront establishment (after the blank interval). Lower subpanel: comparison of speeds between outward and inward traveling waves. Traveling wave speeds are measured locally at the location indicated by the purple dashed line, with each dot’s X-coordinate as the time of local firing rate max. Dot size corresponds to F-test p-value (significance level: 0.001) and color represents the direction of propagation. Outward waves (n=34) travel at a significantly lower speed than inward waves (n=23) (U-test, p<0.001). (C) Rhythmic seizure onset recorded from Patient B. Upper subpanel: averaged LFP recorded from the microelectrode array. Lower subpanel: traveling wave direction (dot color) and speed (Y-coordinates), estimated according to the spatiotemporal distribution of multiunit spikes. The seizure started with periodic LFP discharges before fast activity emerged. As the seizure evolved, traveling wave direction switched (dot color: orange to purple) and the speed increased (U-test p<0.001, n = 67 versus 49), analogous to the outward-to-inward switch predicted in Panel B.


