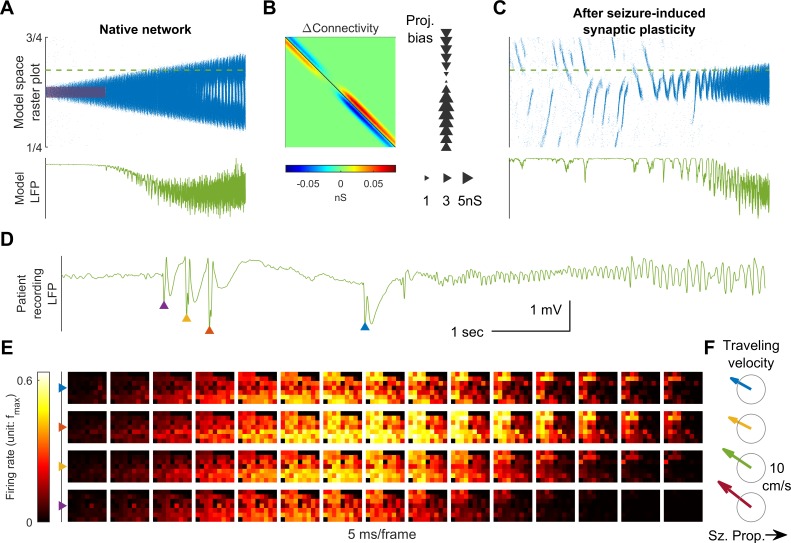
Figure 5. Connectivity induced by spike-timing dependent plasticity may promote emergence of seizure foci.
(A) Raster plot of a provoked model seizure with LVFA onset pattern. Figure conventions are inherited from Figure 4A. Red shaded area indicates the epileptogenic input =200 pA for 3 seconds). Stochastic background input: =20 pA, =0.1, =15 ms. The vertical axis is normalized spatial scale and aligned with Panel B and C. The green dashed line indicates where the simulated LFP, shown in the lower subpanel, is calculated. (=0.05 nS, =1.5 mV) (B) Changes in recurrent excitatory connectivity strength, , induced by STDP after the provoked model seizure (rows correspond to postsynaptic labels, columns to presynaptic). Left subpanel: the matrix. Right subpanel: neuronal projection bias calculated from the matrix (see Materials and methods). The location, size, and direction of the triangles represent the position of the neuron, magnitude and direction of the neuron's projection bias respectively. (C) A spontaneous seizure after seizure-induced synaptic plasticity (=0 pA). Several large amplitude LFP discharges, shown in the lower subpanel, precede the seizure onset. These LFP discharges are generated by the centripetal traveling waves seen in the raster plot. (D) LFP discharges recorded immediately before Patient A’s seizure onset. Discharges are marked by triangles of different colors. Evolution of the associated multiunit firing pattern is shown in Panel E. (E) Multiunit firings constitute traveling waves (10 ms kernel) before LVFA seizure onset. Note that the right half of the array detected multiunit firings earlier than the left half, which is opposite to the expansion direction of the ictal core (left to right). (F) Estimated traveling wave direction and speed. Gray circle: 10 cm/sec.

