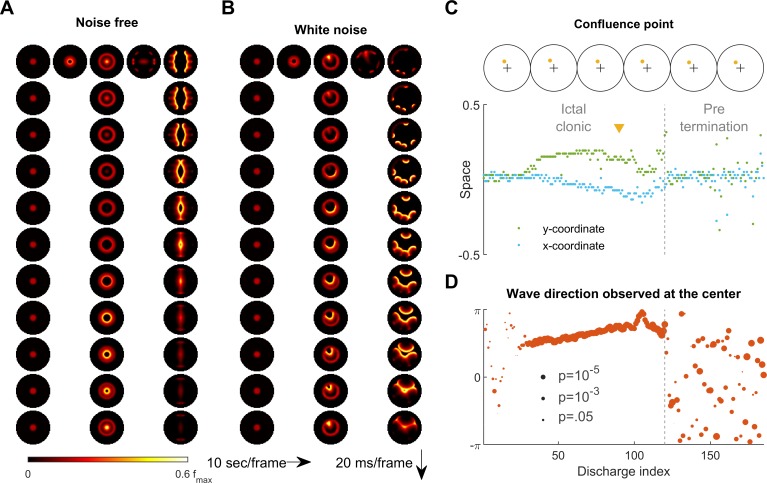
Figure 6. Consistent inward traveling wave direction can emerge from white noise.
(A) Simulation results of a spatially bounded, two-dimensional rate model under a noise free condition. The epileptogenic stimulus was provided at the center of the round field (=200 pA, 3 second, stimulation radius = 0.05). Seizure territory slowly expands (the top row, left to right, 10 seconds per frame) and evolves in stages. The 1st column shows the tonic stage during which the firing rate within the seizure territory stays largely constant (20 ms per frame vertically). The 2nd and 3rd columns show the clonic and pre-termination stages, respectively. Because the neural sheet is symmetric and noise-free, all inward traveling waves meet exactly at the center. (B) Simulation protocol as in panel A but with spatiotemporally white noise with diffusion coefficient 200 pA2/ms is injected uniformly over the whole neural sheet. The confluence point of inward traveling waves during the clonic stage deviates from the center (middle column). Complex, asymmetric traveling wave generation is observed during the pre-termination stage (right column). (C) Locations of confluence points, quantified from Panel B. The upper row: confluence point locations of 6 consecutive inward traveling waves (marked in yellow). The lower subpanel: evolution of the confluence point locations. During the clonic stage (n=120), confluence points significantly deviate from the center (signed-rank test for both and coordinates, p <0.001) and drift slowly (auto-correlation coefficients: =0.82, =0.83; both p < 0.001.). (D) Traveling wave direction estimated at the center (radius = 0.05). White noise generates a consistent traveling wave direction during the clonic stage once the confluence point drifts away from the center. Circular auto-correlation during the ictal clonic stage: 0.97, p<0.001, n = 120. However, traveling wave direction becomes more variable during the pre-termination stage: =0.09, p=0.5, n = 65.


