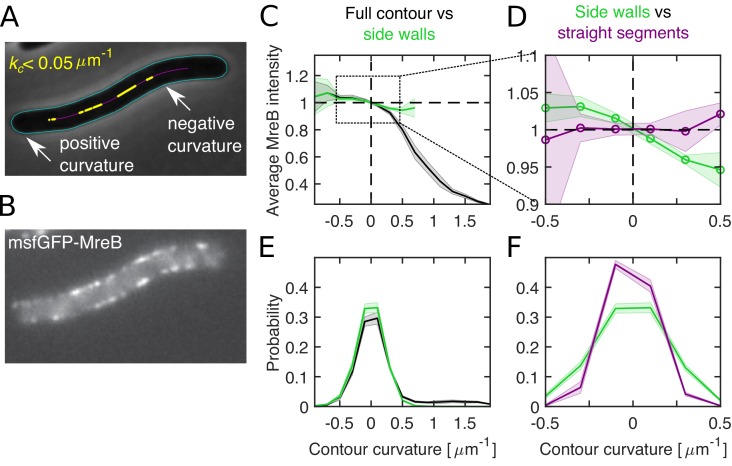
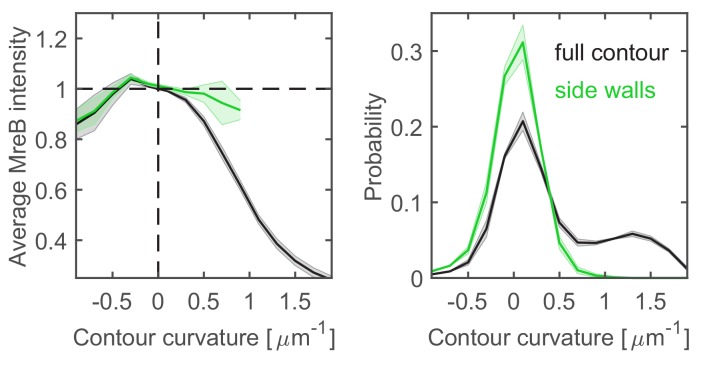
Figure 6. Differential MreB-curvature correlations in filamentous cells are due to cell poles and cell bending.
(A–B) Phase-contrast image (A) and fluorescence intensity (B) of a representative filamentous E. coli expressing MreB-msfGFP and SulA (NO53/pDB192). Contours (cyan) are obtained by computational cell segmentation. Positive contour curvature is found at cell poles, bulges, and outer parts of spontaneously bent regions, while negative curvature is found at indentations and inner parts of bent regions. Straight cell segments (yellow) are defined as regions where the curvature of the spatially averaged centerline (magenta) is smaller than 0.05 μm−1. (C–D) Normalized average MreB intensity as a function of local contour curvature. Comparison between correlations obtained from full contours (black) and side walls (green) (C) and from side walls (green) and straight cell segments (magenta) (D). (E–F) Distributions of contour-curvature values corresponding to correlation plots in (C–D). Shaded region: Standard deviation between three biological replicates.


