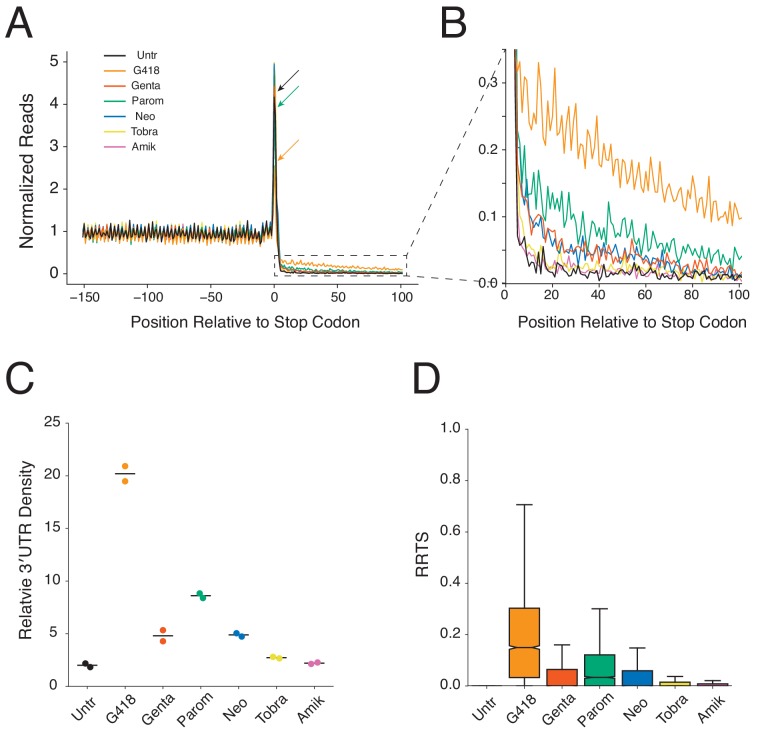
Figure 2. Aminoglycosides stimulate genome-wide stop codon readthrough.
(A) Average gene plot showing normalized ribosome densities relative to the distance, in nucleotides, from the stop codon at position 0. Ribosome densities from untreated cells (black), or cells treated for 24 hr with G418 (orange, 0.5 mg/mL), gentamicin (red, 0.5 mg/mL), paromomycin (green, 3 mg/mL), neomycin (blue, 2 mg/mL), tobramycin (yellow, 1 mg/mL), and amikacin (pink, 2 mg/mL) cells are overlaid. Arrows demonstrate the height of peaks at stop codons for Untr, G418, and paromomycin to facilitate comparison. (B) Magnified view of the 3′UTR showing increased densities of ribosomes in this region for AG treated cells. (C) Densities of ribosomes in 3′UTRs (from +5 to +100) are plotted relative to densities of ribosomes in the coding sequence (positions −147 to −16) for each AG. Each replicate is displayed, along with the mean value. (D) RRTS values are displayed for all genes in pooled replicates using box and whisker plots. Median values are represented with the notch indicating the 95% confidence interval, and whiskers representing 1.5 times the interquartile range. Outliers are not shown.


