. 2020 Jan 23;9:e52611. doi: 10.7554/eLife.52611

Figure 3. 3′UTR ribosomes in G418-treated cells derive from stop codon readthrough.

(A) Average gene plot showing increased density of ribosomes in 3′UTRs in G418-treated cells (orange) relative to untreated cells (black). Reading frame is analyzed for (B) Untreated and (C) G418-treated cells showing the percent of ribosomes in a given frame in the CDS and 3′UTR. (D) Gene models of HSPA1B (left) and APRT (right) showing translation of the 3′UTRs of these genes. G418-treated cells (orange lines) are overlaid onto untreated cells (black lines). The wider blue bar below the plot indicates the CDS and the narrow blue bar represents the 3′UTR. In-frame 3′TCs are colored in red, while out-of-frame 3′TCs are colored in gray. (E) Average gene plots show total ribosome density in the region surrounding the first in-frame 3′TC when found in frame −1 (left), frame 0 (center), or frame +1 (right). Transcripts with additional 3′TCs in this window were excluded for this analysis.

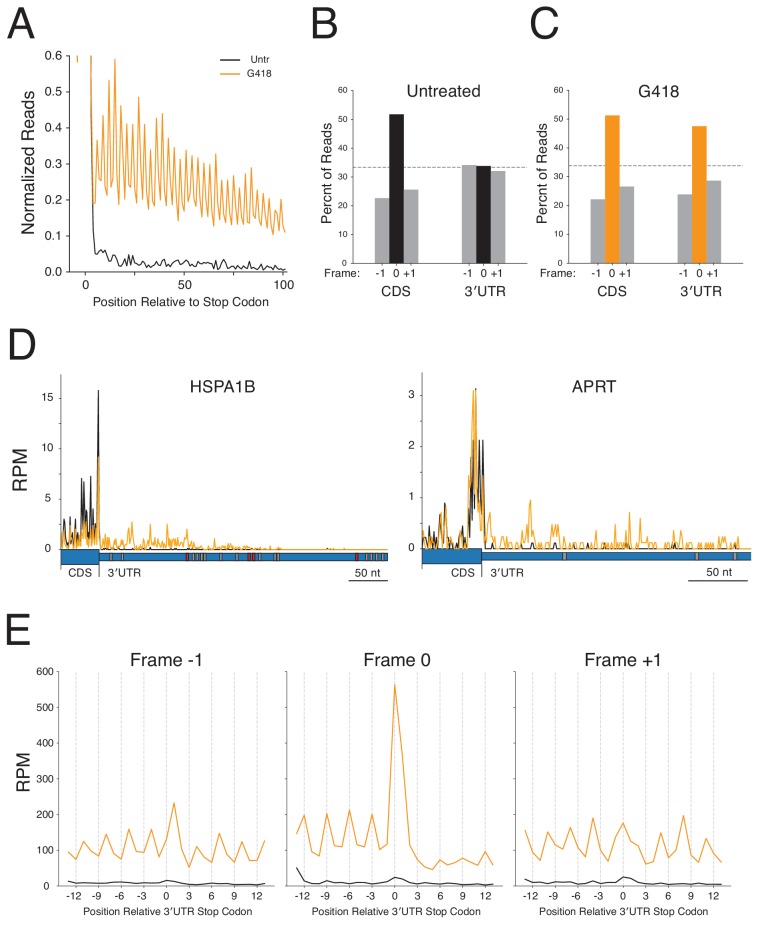
Figure 3—source data 1. Source data from ribosome profiling analysis used in Figure 3 and Figure 4.

Figure 3.

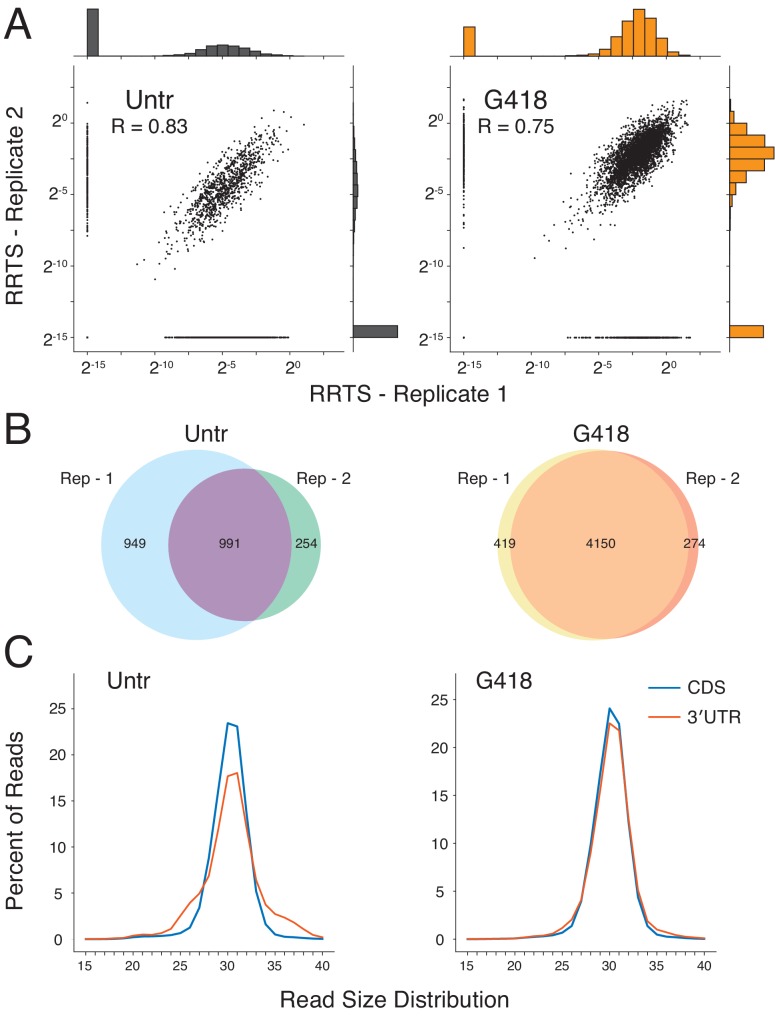
Figure 3—figure supplement 1. Defining features of RPFs in deeper sequencing libraries.

Figure 3—figure supplement 1.

(A) RRTS correlations were compared between biological replicates from ribosome profiling libraries with greater sequencing depth. Pearson correlations indicate strong correlation between replicates (R > 0.7). (B) Venn diagrams indicate the total number of transcripts with non-zero RRTS values for both replicates of untreated (left) and G418-treated (right) cells and the reproducibility of readthrough detection between replicates. (C) Read size distributions showing strong agreement of read lengths between the CDS (blue) and the 3′UTR (red).
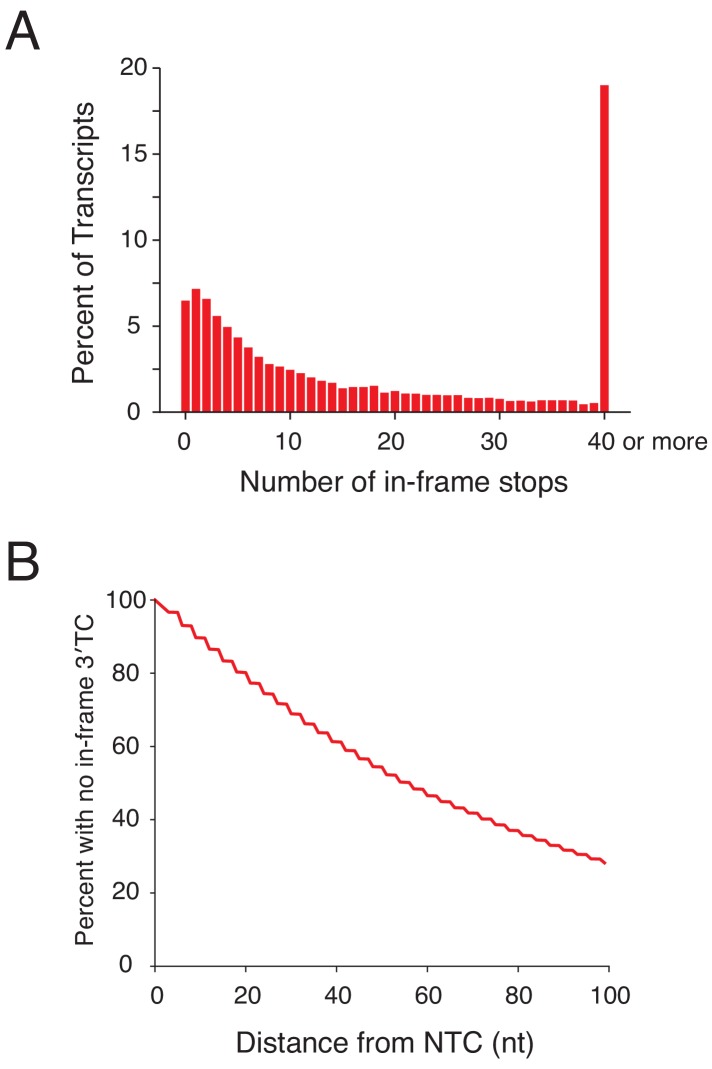
Figure 3—figure supplement 2. Analysis of in-frame stop codons in 3′UTRs genome-wide.

Figure 3—figure supplement 2.

(A) All transcripts were sorted by the number of in-frame 3′TCs present in 3′UTRs. Approximately 7% of transcripts have no in frame termination codon. Transcripts with greater than 40 in-frame 3′TCs were pooled into the final bin. (B) A survival curve demonstrating the percent of transcripts that have not yet encountered an in-frame 3′TC, as a function of distance from the NTC in nucleotides.