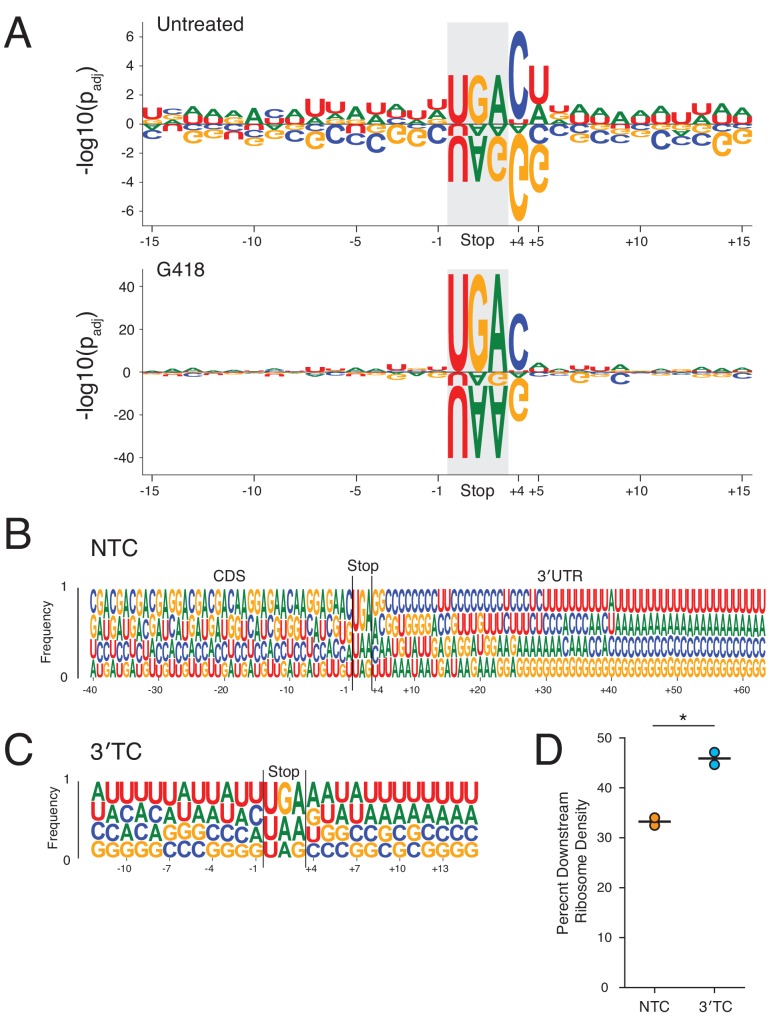
Figure 5. Surrounding sequence context influences stop codon readthrough genome-wide.
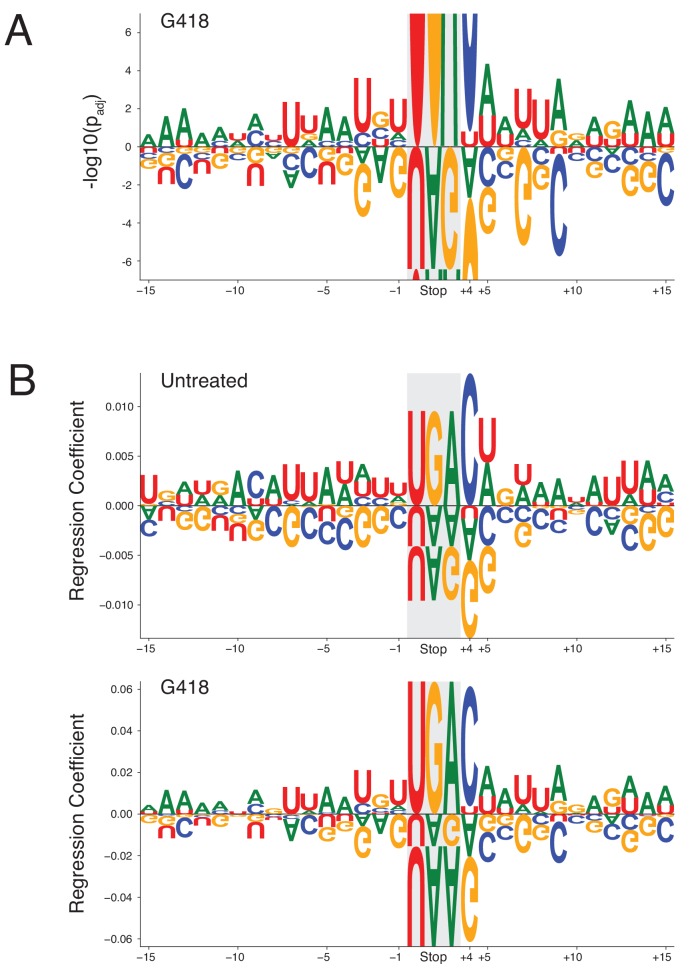
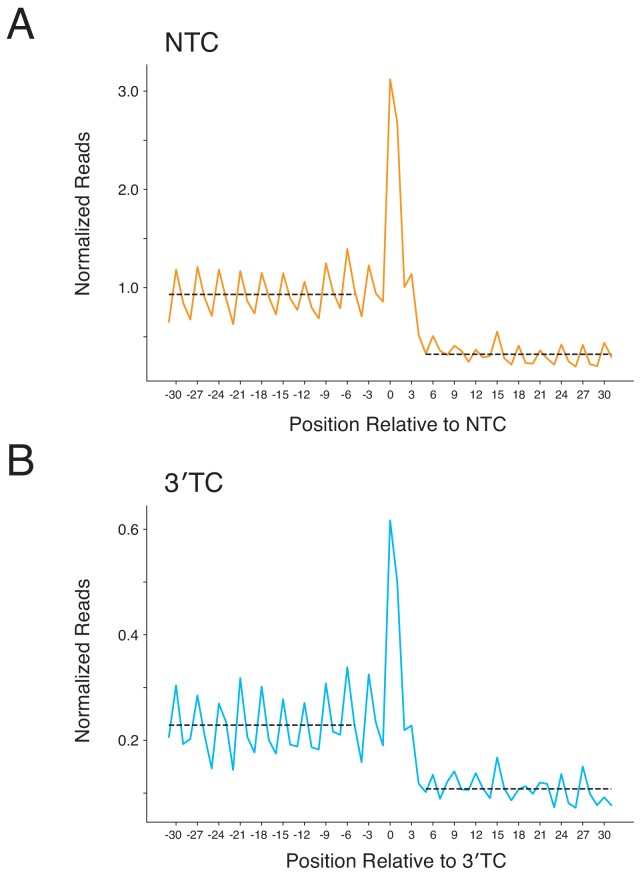
(A) Within a sequence window corresponding to the footprint of a translating ribosome at the NTC (15 nt upstream to 12 nt downstream), the likelihood of each nucleotide increasing or decreasing RRTS is plotted with positive values indicating more readthrough and negative values indicating less readthrough. Each nucleotide was tested using one-sided t-tests against all other nucleotides at each position for untreated (top) and G418-treated (bottom) cells. P values were adjusted using the Benjamini-Hochberg correction. Letters are scaled in proportion to the adjusted P value. (B) The frequencies of each nucleotide are plotted for all positions 40 nt upstream to 60 nt downstream of the stop codon. Nucleotides are plotted in order of increasing frequencies. (C) As in (B), nucleotide frequencies are plotted for first in-frame 3′TCs, 12 nt upstream to 12 nt downstream of the 3′TC. (D) Using normalized ribosome densities in a window 30 nt upstream to 30 nt downstream of stop codons, ribosome density downstream of stop codons was calculated for NTCs and the first in-frame 3′TCs in G418-treated cells. A paired t-test was performed revealing significant differences between levels of SCR between 3′TCs and NTCs (p=0.02).


