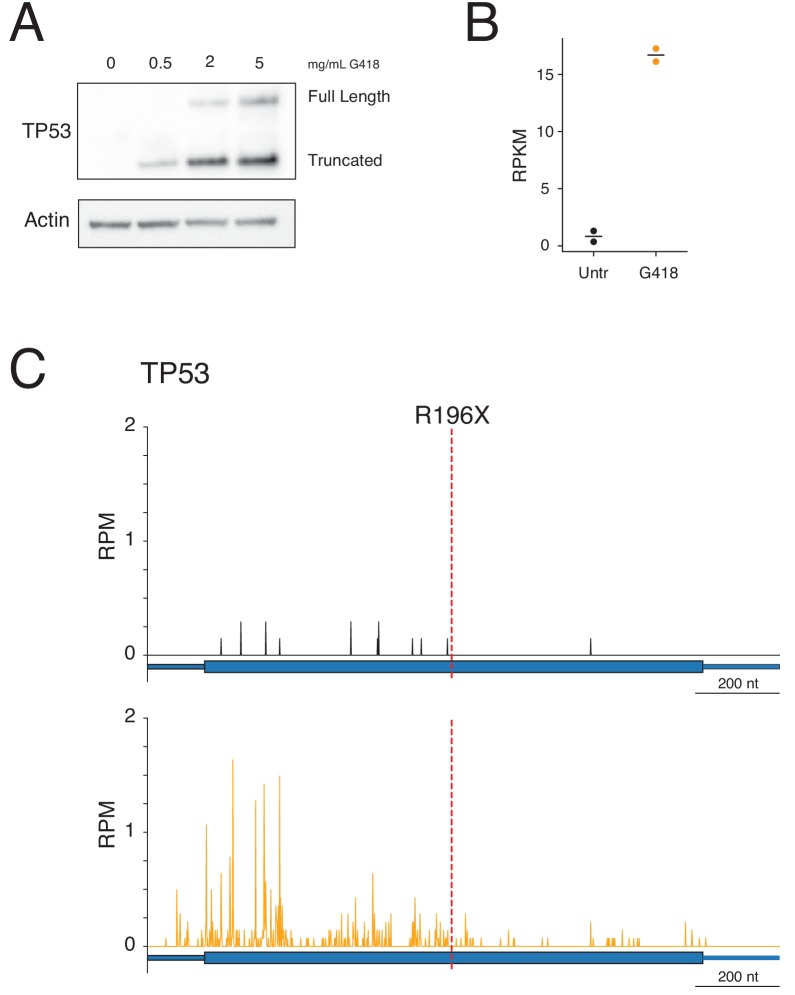
Figure 6. G418 stimulates readthrough of a PTC in TP53.
(A) Western blot showing TP53 protein levels (top) following 24-hour G418 treatment in Calu-6 cells harboring a nonsense mutation in TP53 at R196X. Full-length protein corresponds to the expected size of the readthrough product and the truncated band corresponds to translation termination at the PTC. (B) Quantification of mRNA levels in Calu-6 cells by RNA-seq in two biological replicates reveals increased mRNA abundance of TP53 following G418 treatment. (C-D) Ribosome profiling reads mapped to TP53 gene model for (C) untreated and (D) G418-treated cells. The red line at nucleotide 722 of the mRNA indicates the position of the R196X PTC.
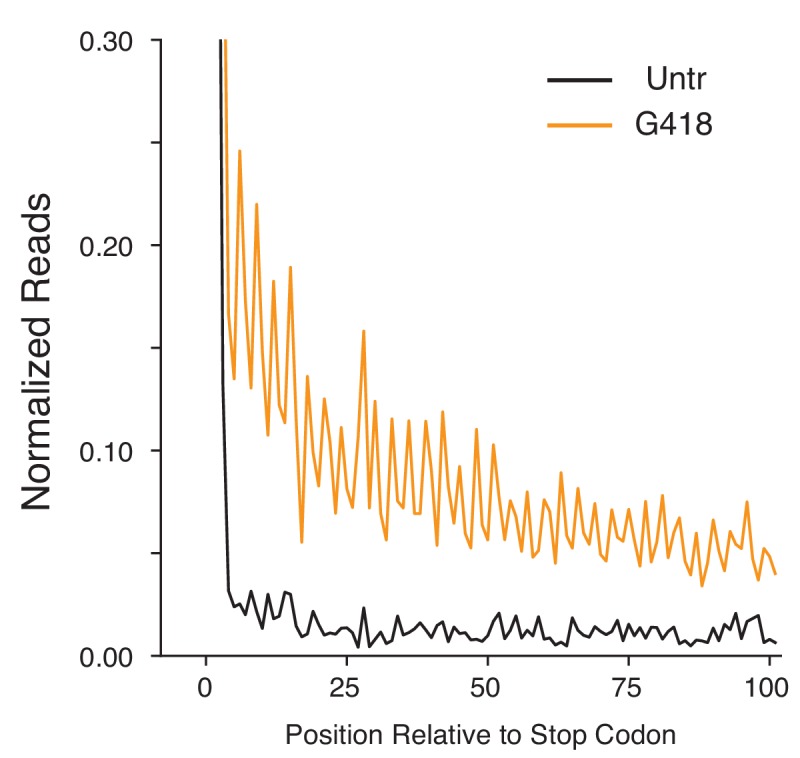
Figure 6—figure supplement 1. G418 stimulates genome-wide SCR in Calu-6 cells.


