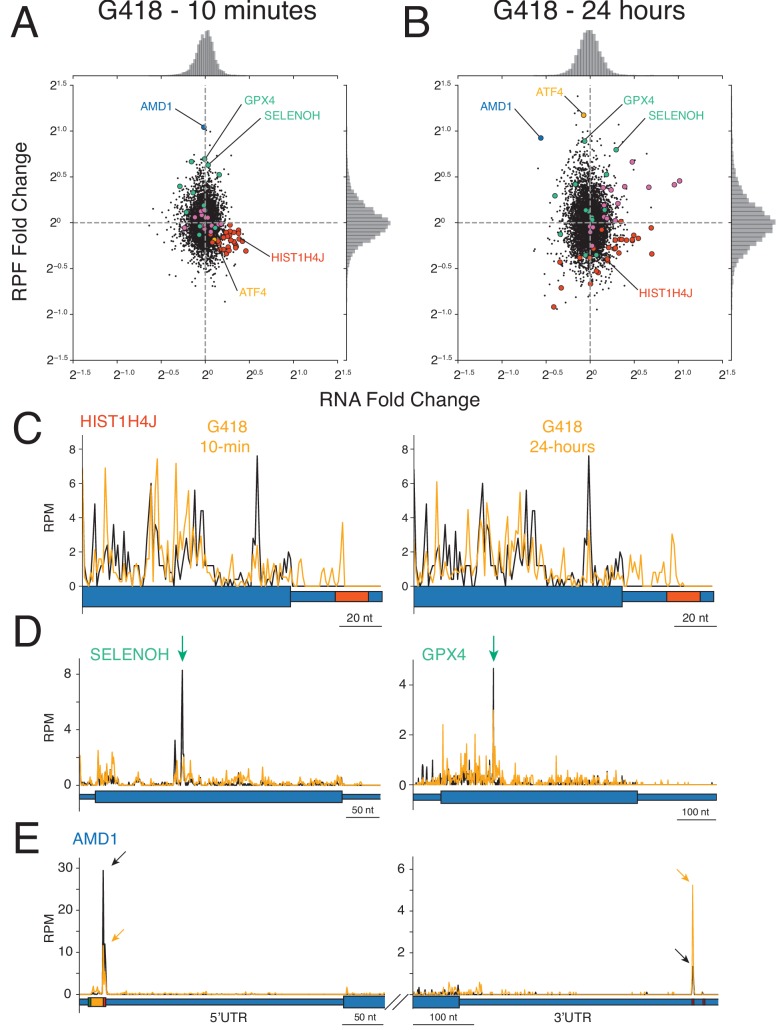
Figure 7. Impact of G418 on gene expression.
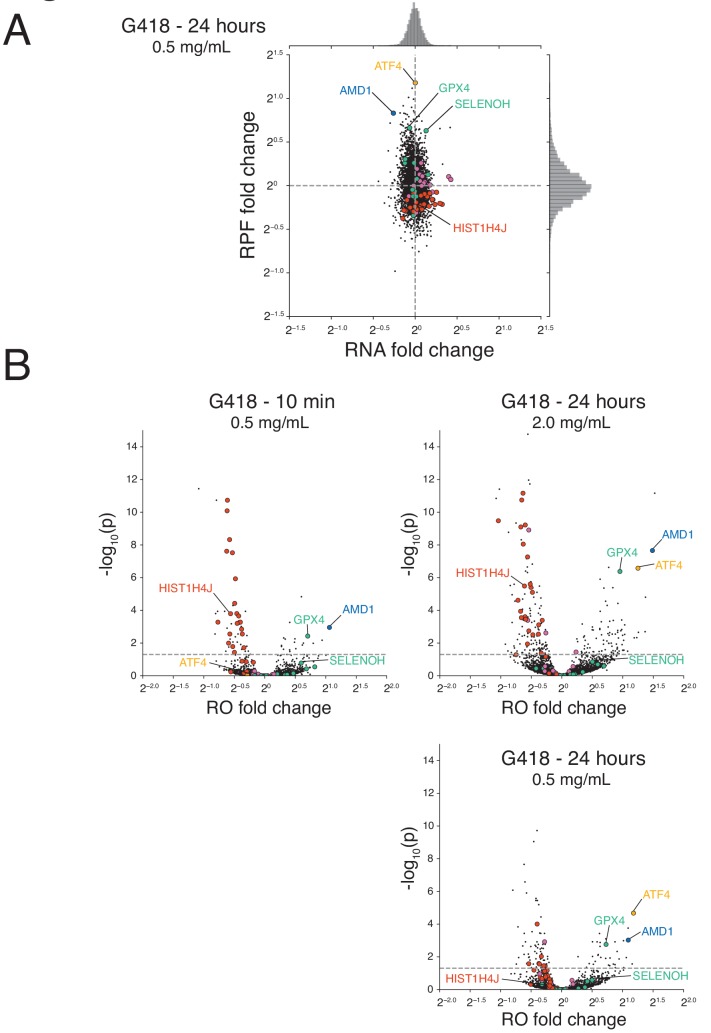
(A–B) Changes in mRNA abundance (x-axis) and RPF abundance (y-axis) were calculated for cells (A) treated with G418 (0.5 mg/mL) for 10 min or (B) treated with G418 (2.0 mg/mL) for 24 hr. Several noteworthy genes are highlighted including histone genes (red), selenoproteins (green), chaperone proteins and foldases (purple), ATF4 (orange), and AMD1 (blue). (C-E) Gene models show translation of several genes altered by G418 treatment (orange) relative to untreated (black) cells. Blue bars indicate the position along the mRNA with wide bars representing the CDS and narrow bars representing UTRs. (C) Translation of a representative histone gene HIST1H4J at the 10 min (left) and 24 hr (right) time points reveal that G418 induces translation into RNA hairpins of histone mRNAs indicated by the red box in the 3′UTR. (D) Translation of two selenoproteins, SELENOH (left) and GPX4 (right). Green arrows indicate UGA codons normally decoded by selenocysteine tRNAs. (E) Translation of AMD1 is altered by G418 treatment. Reduced peaks of ribosomes stalled in the 5′UTR at the stop codon of the uORF encoding the MAGDIS peptide (left). Arrows indicate the height of peaks at the stop codon for untreated (black) and G418-treated (orange) cells to facilitate comparison. The boxes depicting the start (green) and stop (red) codons and coding sequence (orange) of the uORF are enlarged. G418 treatment increases the peak of ribosomes found in the 3′UTR of AMD1 (right, compare orange arrow to black arrow). No in-frame 3′TCs are present between the NTC and stalling site.


