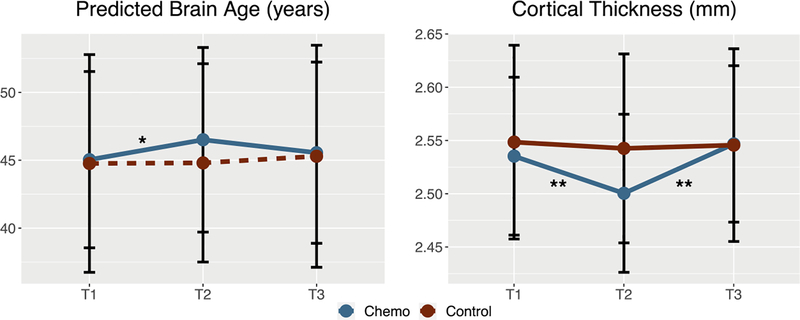
Figure 1.
Predicted brain age and mean cortical thickness across time in patients with breast cancer (Chemo) and healthy female controls (Control). T1 = pre-treatment, T2 = 1 month post-chemotherapy, T3 = 1 year post-chemotherapy (or yoked intervals for controls). Predicted brain age changed significantly from T1 to T2 and cortical thickness changed across all three time points in the breast cancer group compared to controls. * p < 0.05, ** p < 0.001.

