
Fig. 2:
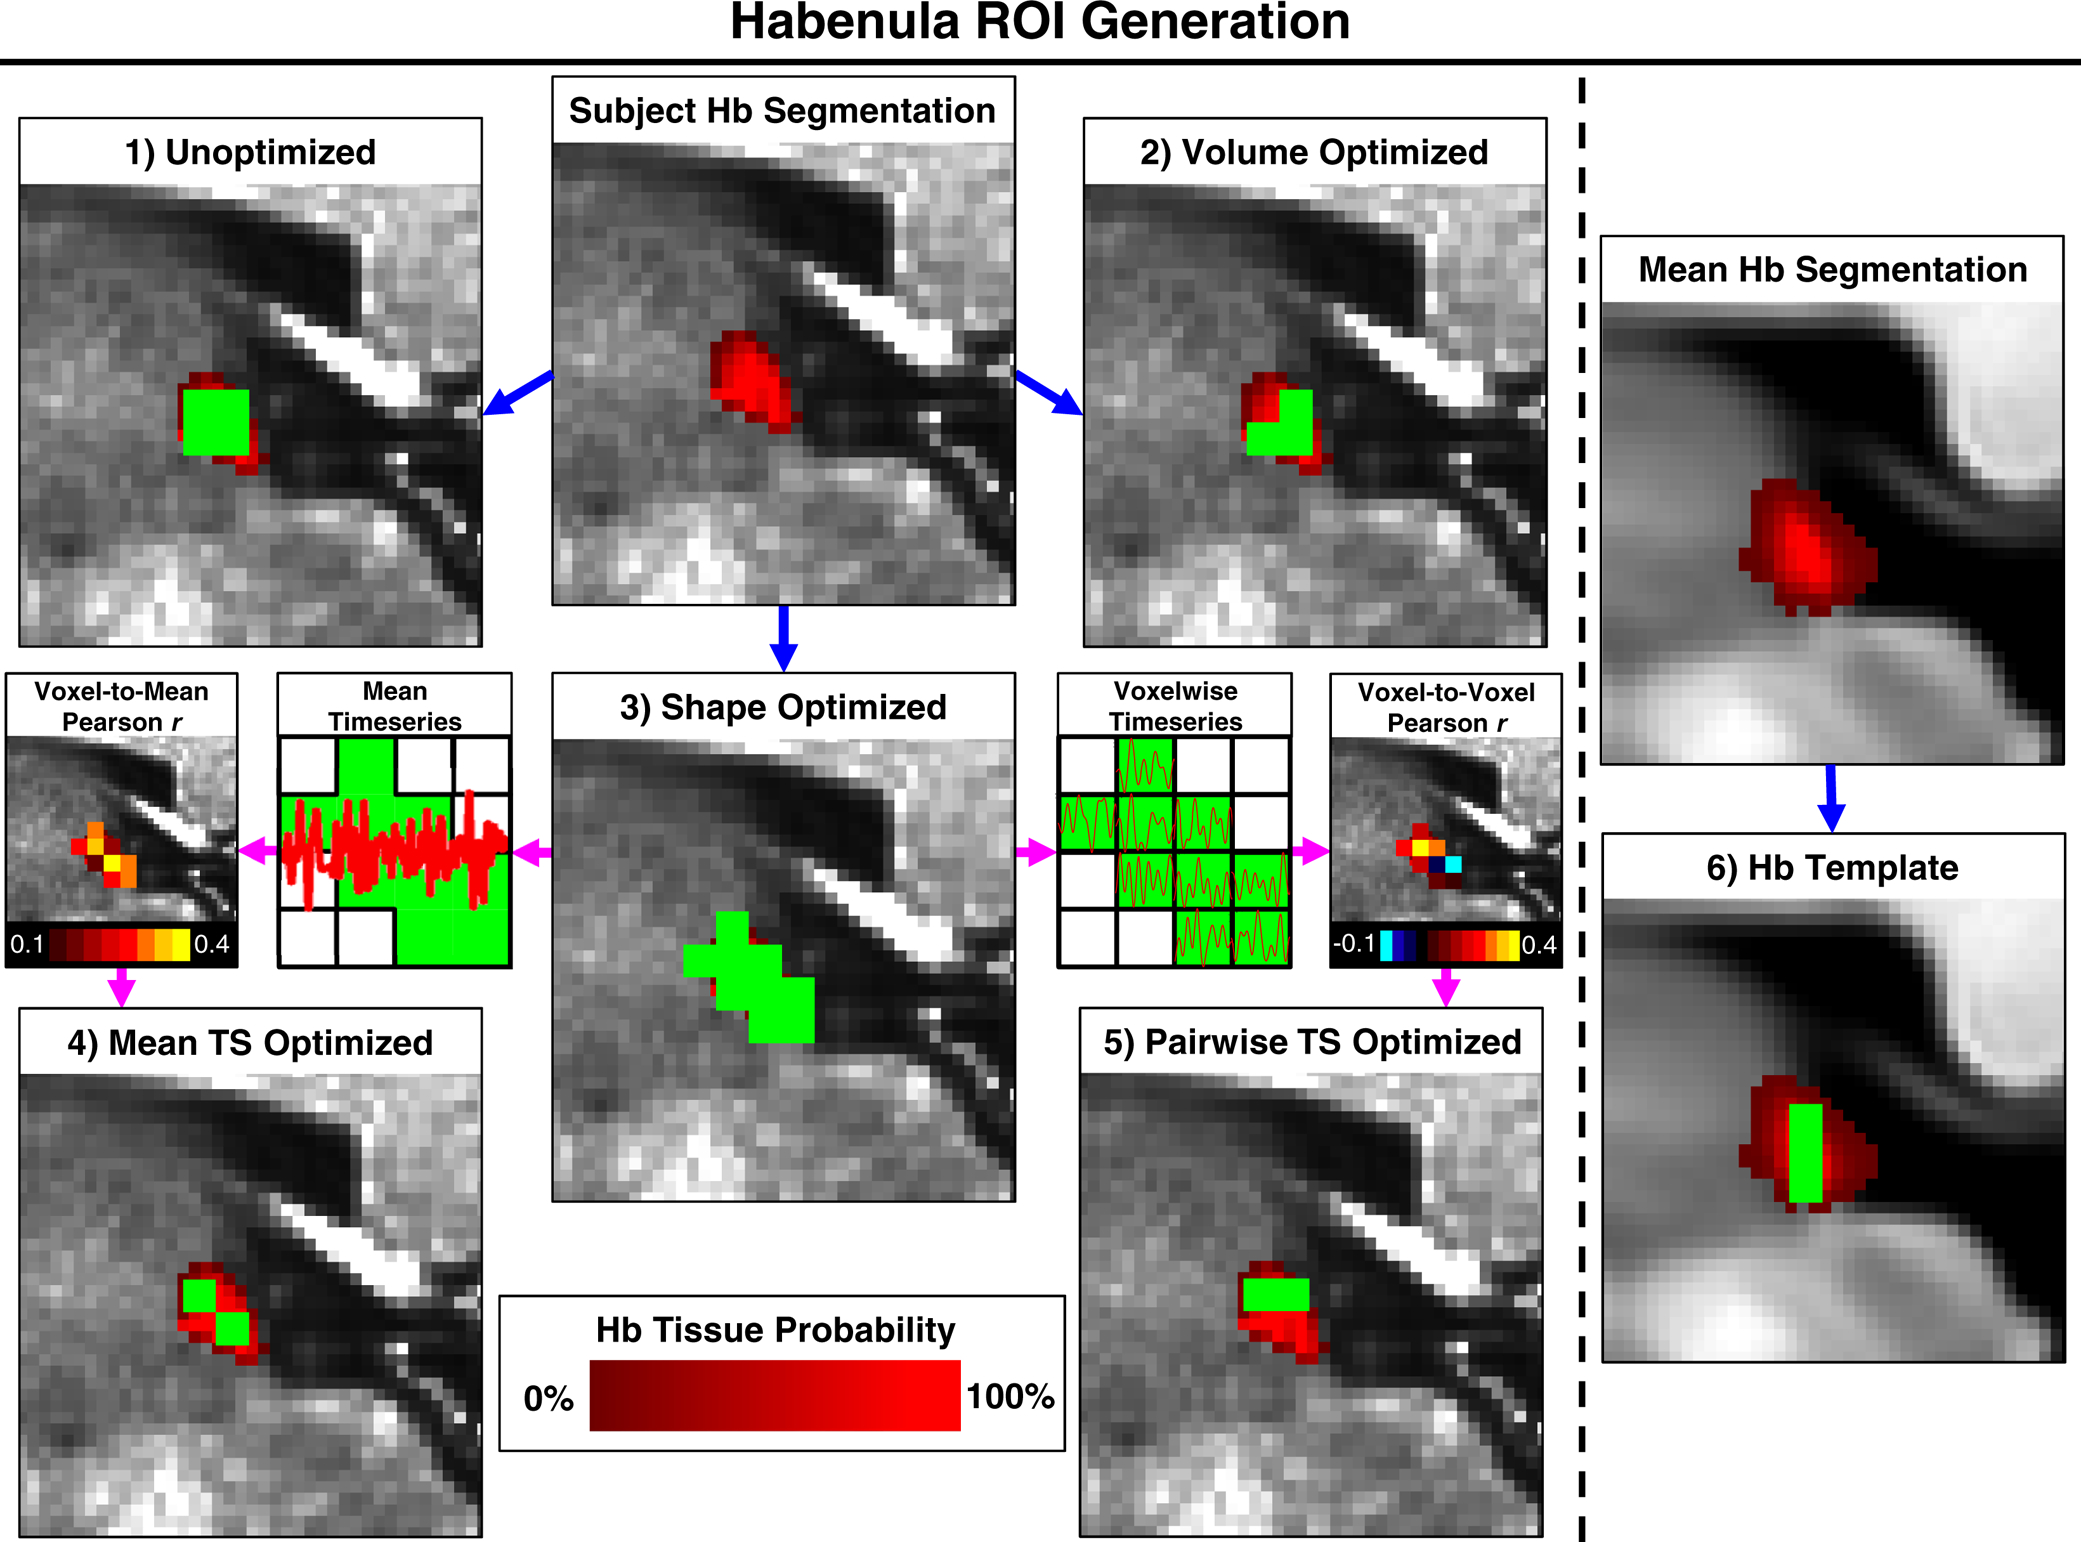
Creation of subject-level Hb ROIs in a representative subject (panels 1–5) and of the group-level Hb Template ROI (panel 6). Hb ROIs at 2mm functional resolution (green) are overlaid on probabilistic anatomical Hb segmentations at 0.7mm anatomical resolution (red). Blue arrows indicate ROIs derived solely from anatomical Hb segmentations. Magenta arrows indicate ROIs derived from both anatomical segmentations and rs-fMRI data (illustrated in subpanels). Note that Volume Optimized (panel 2), Mean Timeseries (TS) Optimized (panel 4), and Pairwise Timeseries (TS) Optimized (panel 5) ROIs contained the same number of voxels, not all of which can be seen in the single slice presented.